R53 Logger - Flasher
Flash MINI's own Stage 1 from an Android phone, put the options you want on top, then log the car and see exactly where the tune misses.
Flash options
Pick a base tune, put the options you want on top, and write it from the phone. It's all applied in memory and checked before a byte goes to the ECU. No hex editor, no second tool.
MINI's calibration for the JCW kit: pulley, 380 cc injectors, freer exhaust. More.
The 2006 GP's calibration for the same parts. Revs higher and runs more aggressive than JCW.
BMW's 200 hp kit tuning for a manual Cooper S with a pulley, on factory injectors. More.
The factory Cooper S calibration, to go back to stock.
Pops, redline, pedal map, injectors, fans and more, on any of the above or your own bin. See them.
Stage 1: MINI's JCW and GP1
Years ago MINI was nice enough to give S owners a Stage 1 flash from the factory. It shipped as the JCW kit. The app puts it on your car.
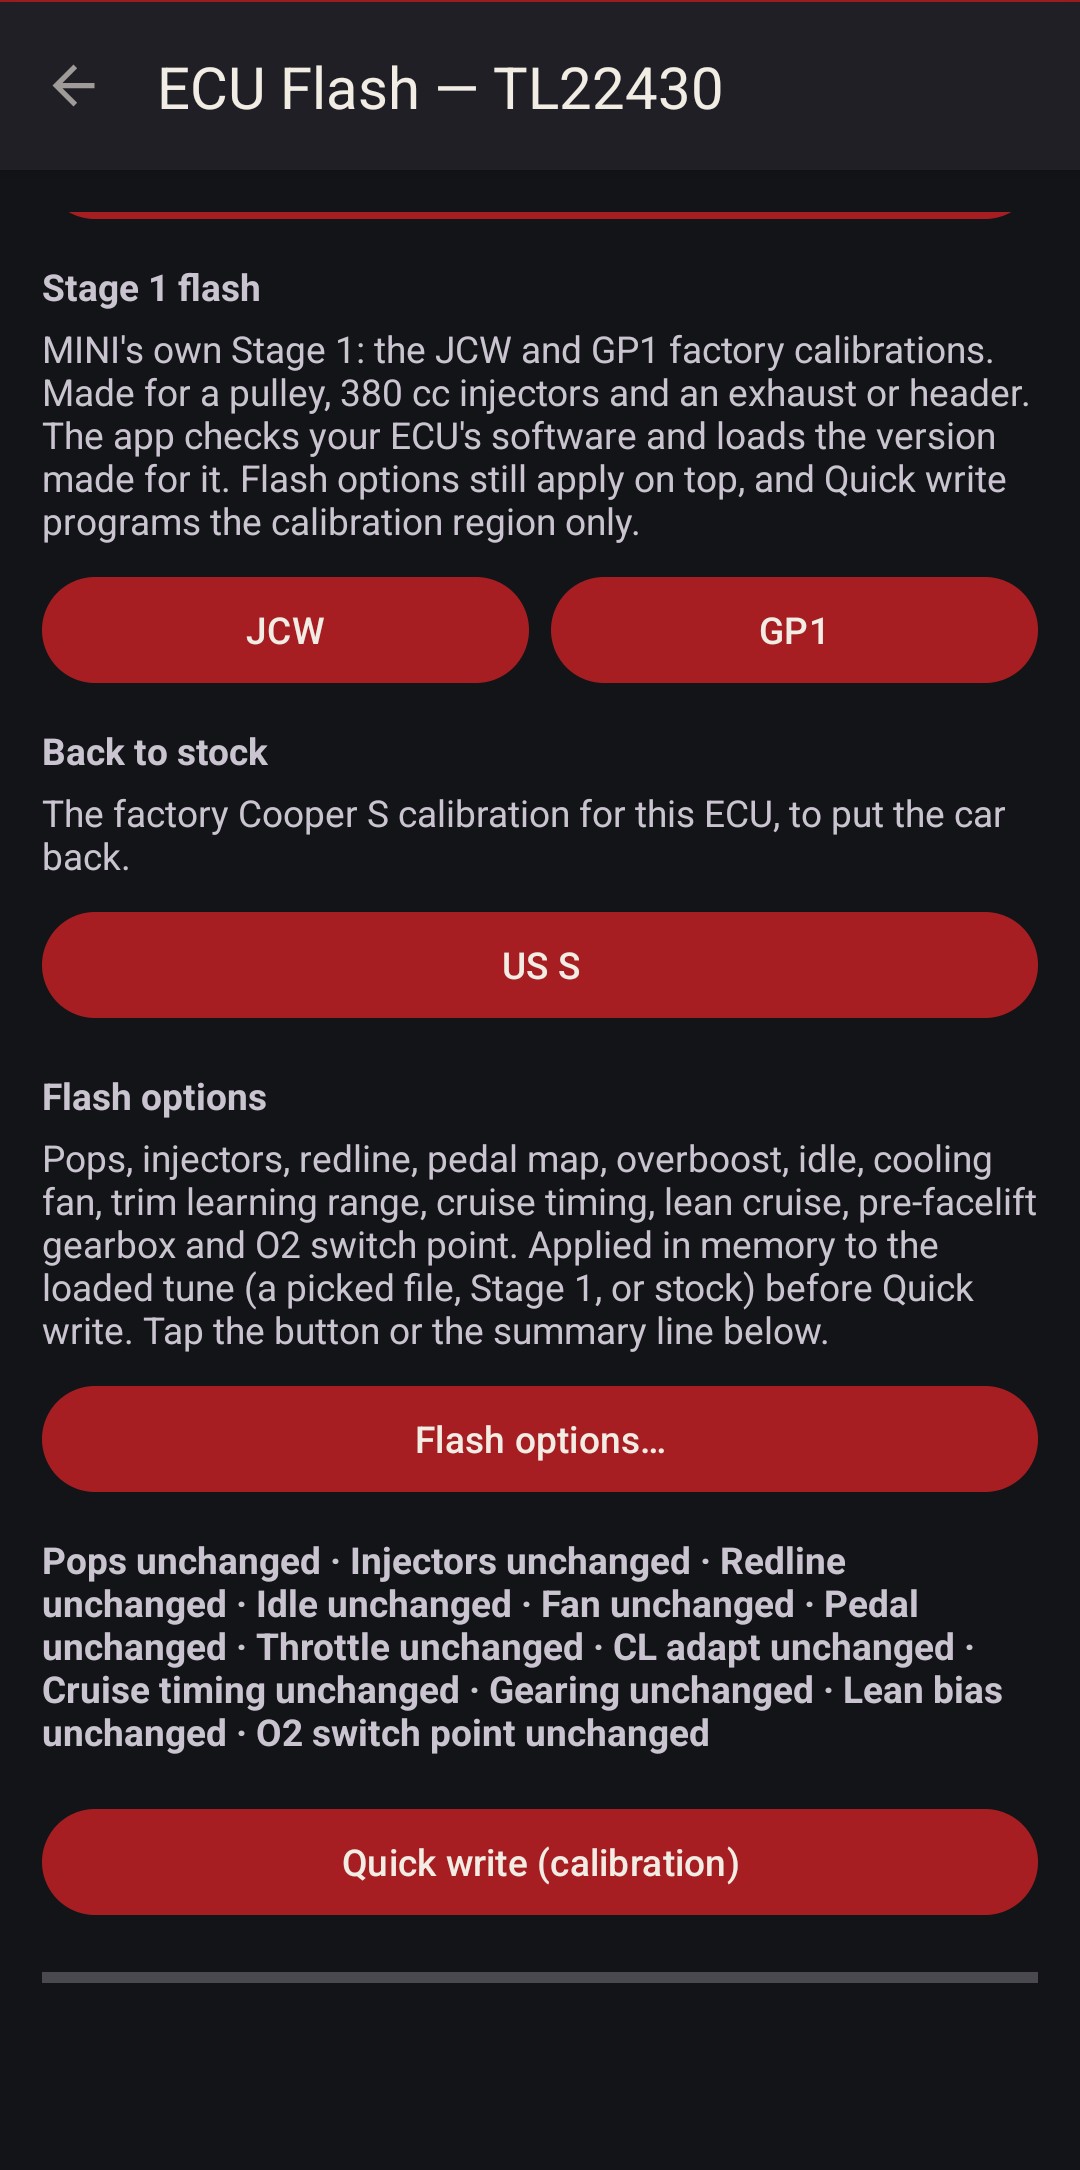
The JCW and GP1 calibrations are MINI's own tunes for an R53 with a smaller pulley, 380 cc injectors and a freer exhaust. That's how most of these cars end up by the time anyone wants a tune.
If your car has a pulley, 380 cc injectors and an exhaust or header, it'll flow close enough to pair well. You don't really need the JCW head. A header and exhaust, or a mild cam, make up for it.
Stage 1 works on early and late cars. The app reads your ECU's software version and loads the calibration made for it: the facelift 740P10, the early 740J10 and 740G00, and the EU 740L00. EU cars get EU images, and automatics on 740P10 get an automatic set. The 740R10 automatic isn't supported for Stage 1 yet. On 740G00 and 740L00 the JCW and GP1 are ported from the factory's own changes.
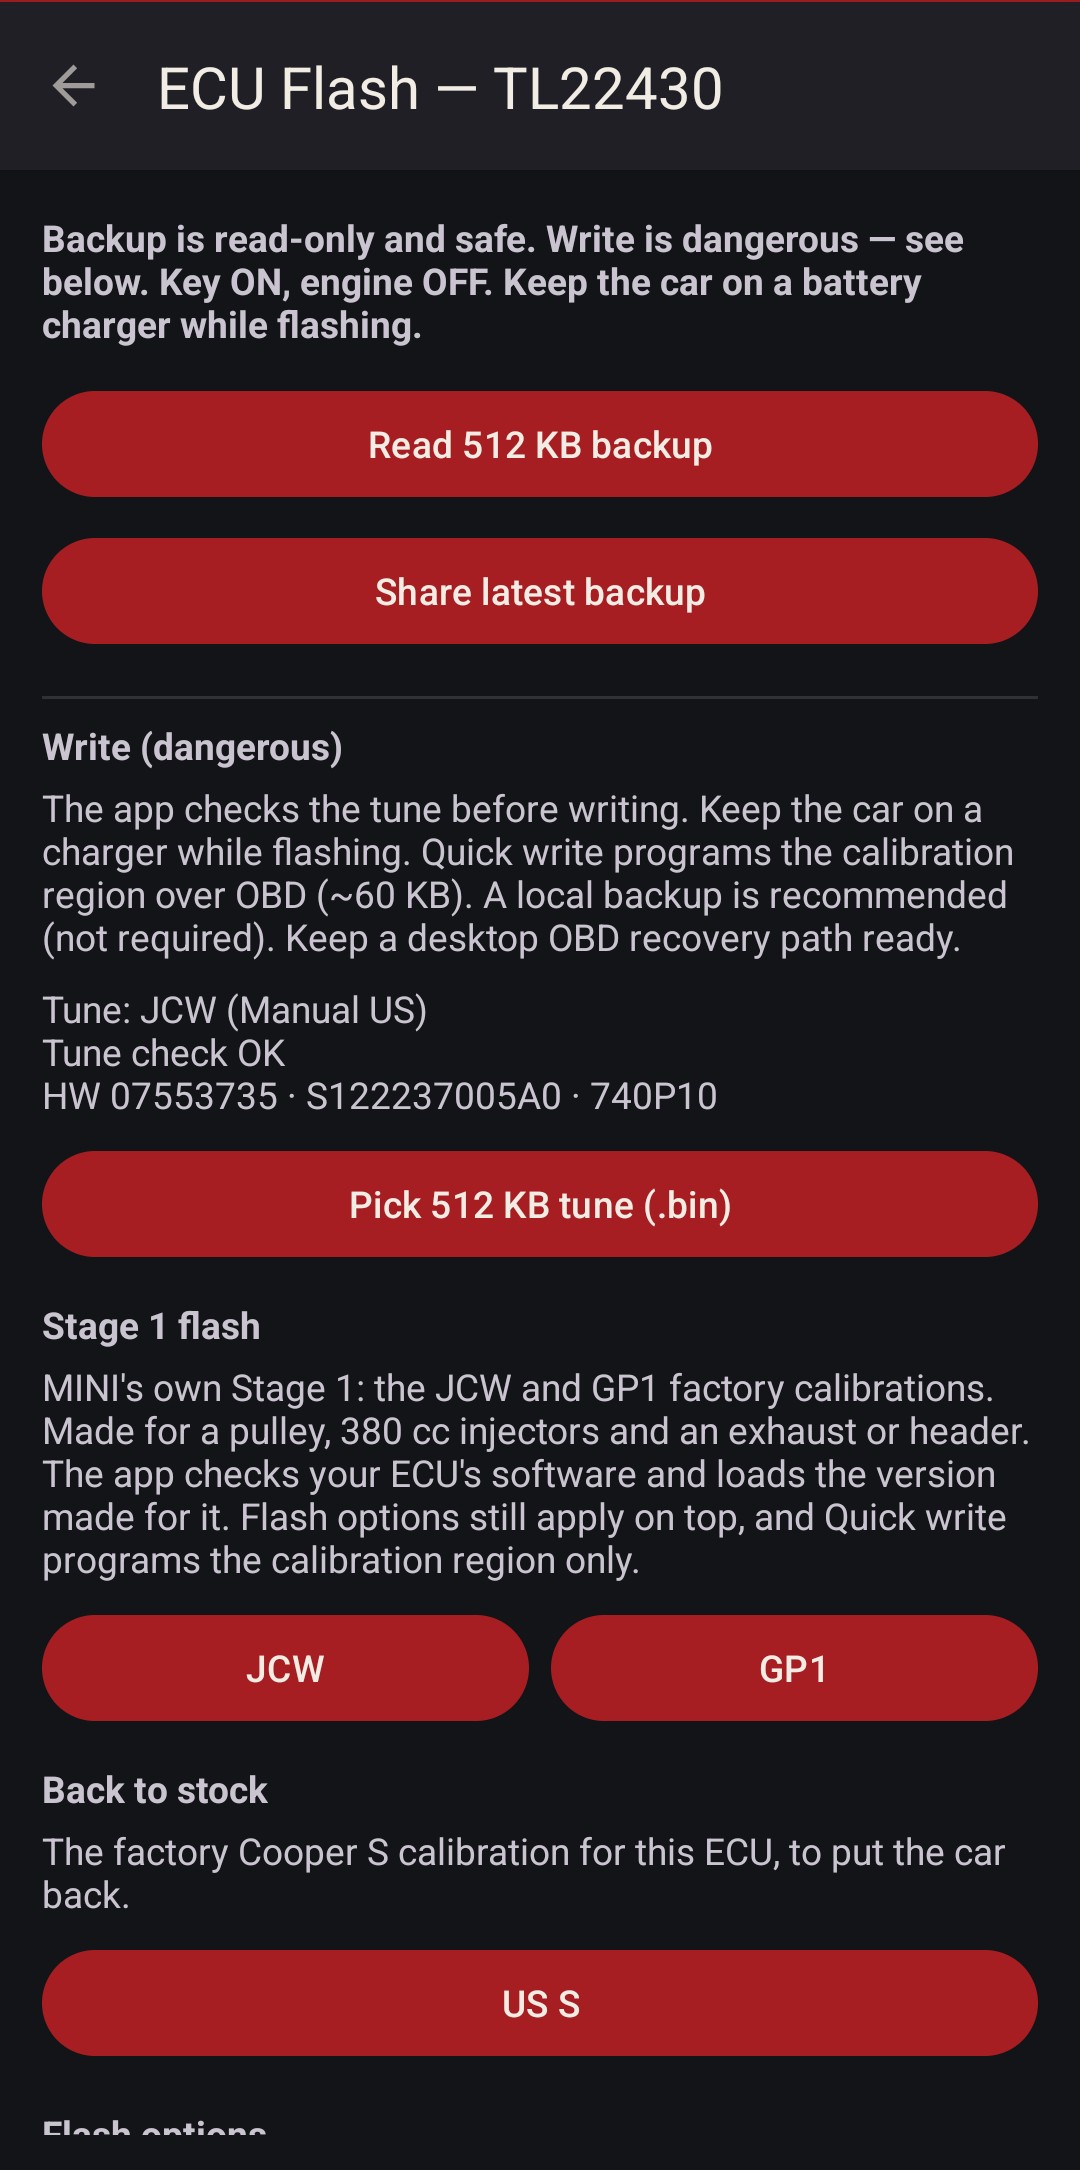
If your ECU version isn't mapped yet, the app says so and offers a Send button. That sends me your backup and the flash log, and I work on porting the JCW and GP1 tables to your ECU version.
Where it sits. For the vast majority of lightly modded R53s this works well enough. A custom tune makes more power, with raised torque and air tables and more ignition advance. This is factory calibration, and it's well proven.
- OEM software. MINI's calibration as the factory wrote it, not a third-party map.
- Needs the 380 cc JCW / GP injectors. Stock 330s can't supply the fuel it asks for. Bigger than 380? Set the injector option to match.
- Flash options still apply on top: pops, redline, pedal map, fans and the rest.
Stage 0: the first JCW kit
A smaller supercharger pulley spins the blower faster and makes more boost. Stage 0 is the software BMW wrote to go with one, for a Cooper S on its stock injectors.
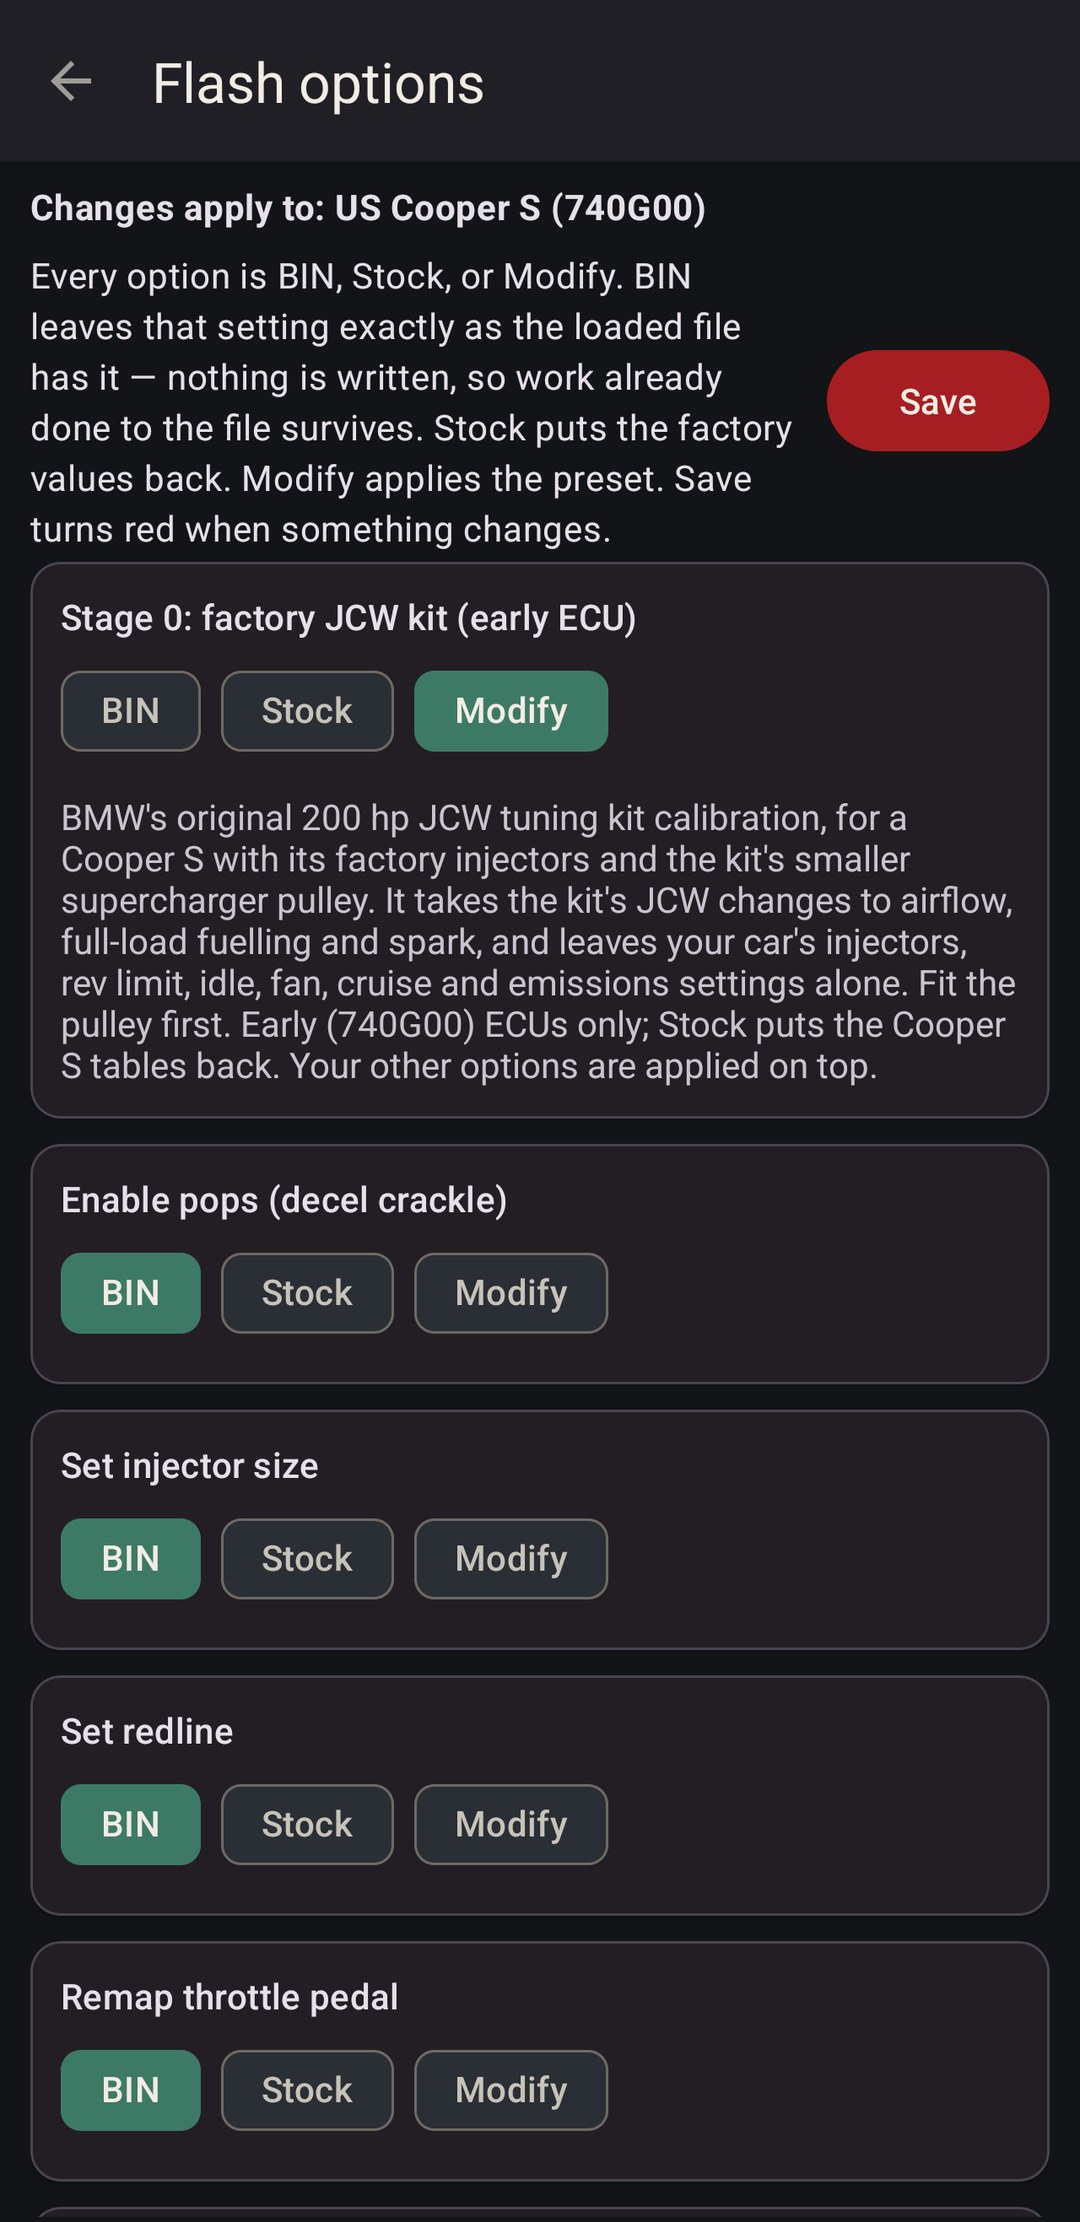
What it is. BMW's first JCW tuning kit for the Cooper S made 200 hp, up from 163. The main part was a smaller pulley, and it came with new ECU software so the engine knew what to do with the extra air. The later kit, the one Stage 1 comes from, added 380 cc injectors. The first one kept the stock ones. Stage 0 is the first kit's software, read off a car that had it.
What it changes. More air needs more fuel, and a little less spark to stay safe. So Stage 0 raises the ECU's airflow limit, adds fuel at the top of the rev range and takes some timing out at high load. That's 14 tables, laid over the Cooper S tune you've loaded.
What it leaves alone. Your injector scaling, rev limiter, idle, fans, cruise and emissions settings. The kit ran the stock 330 cc injectors, so unlike Stage 1 you don't need 380s.
Stage 0 or Stage 1? A pulley on stock injectors: Stage 0. A pulley, 380 cc injectors and an exhaust or header: Stage 1.
- Fit the pulley first.
- Every manual Cooper S ECU:
740P10,740J10,740G00,740L00and740N20. The kit's tables go to each one's own addresses. - For a Cooper S tune. A JCW or GP1 calibration already goes further, so it refuses those, and automatics.
- Flash options still apply on top. Stock puts the Cooper S tables back on
740P10,740J10and740G00. On the others, go back with your own backup.
Options on any tune
Twelve common changes, laid over whatever tune is loaded: Stage 1, Stage 0, stock, or your own.
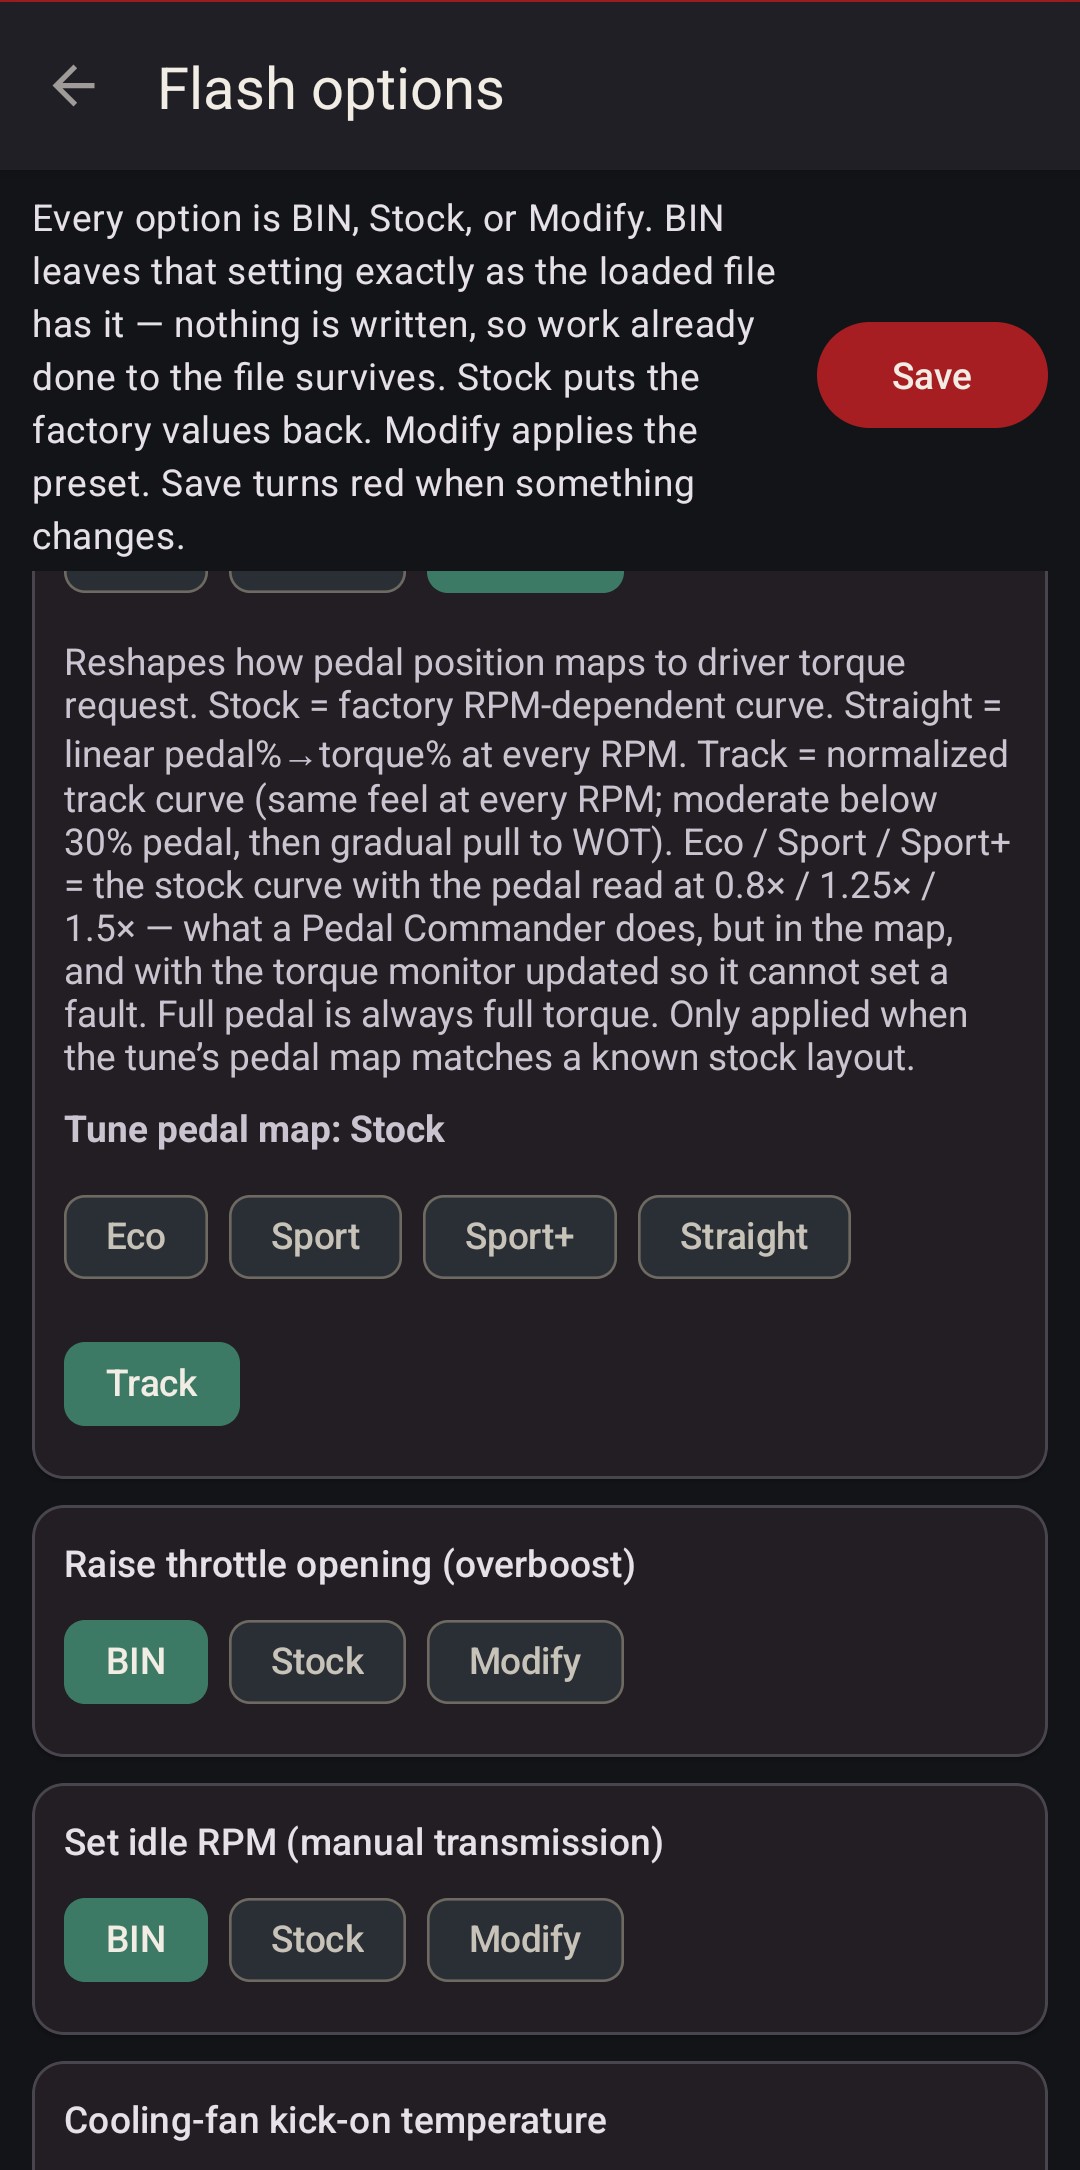
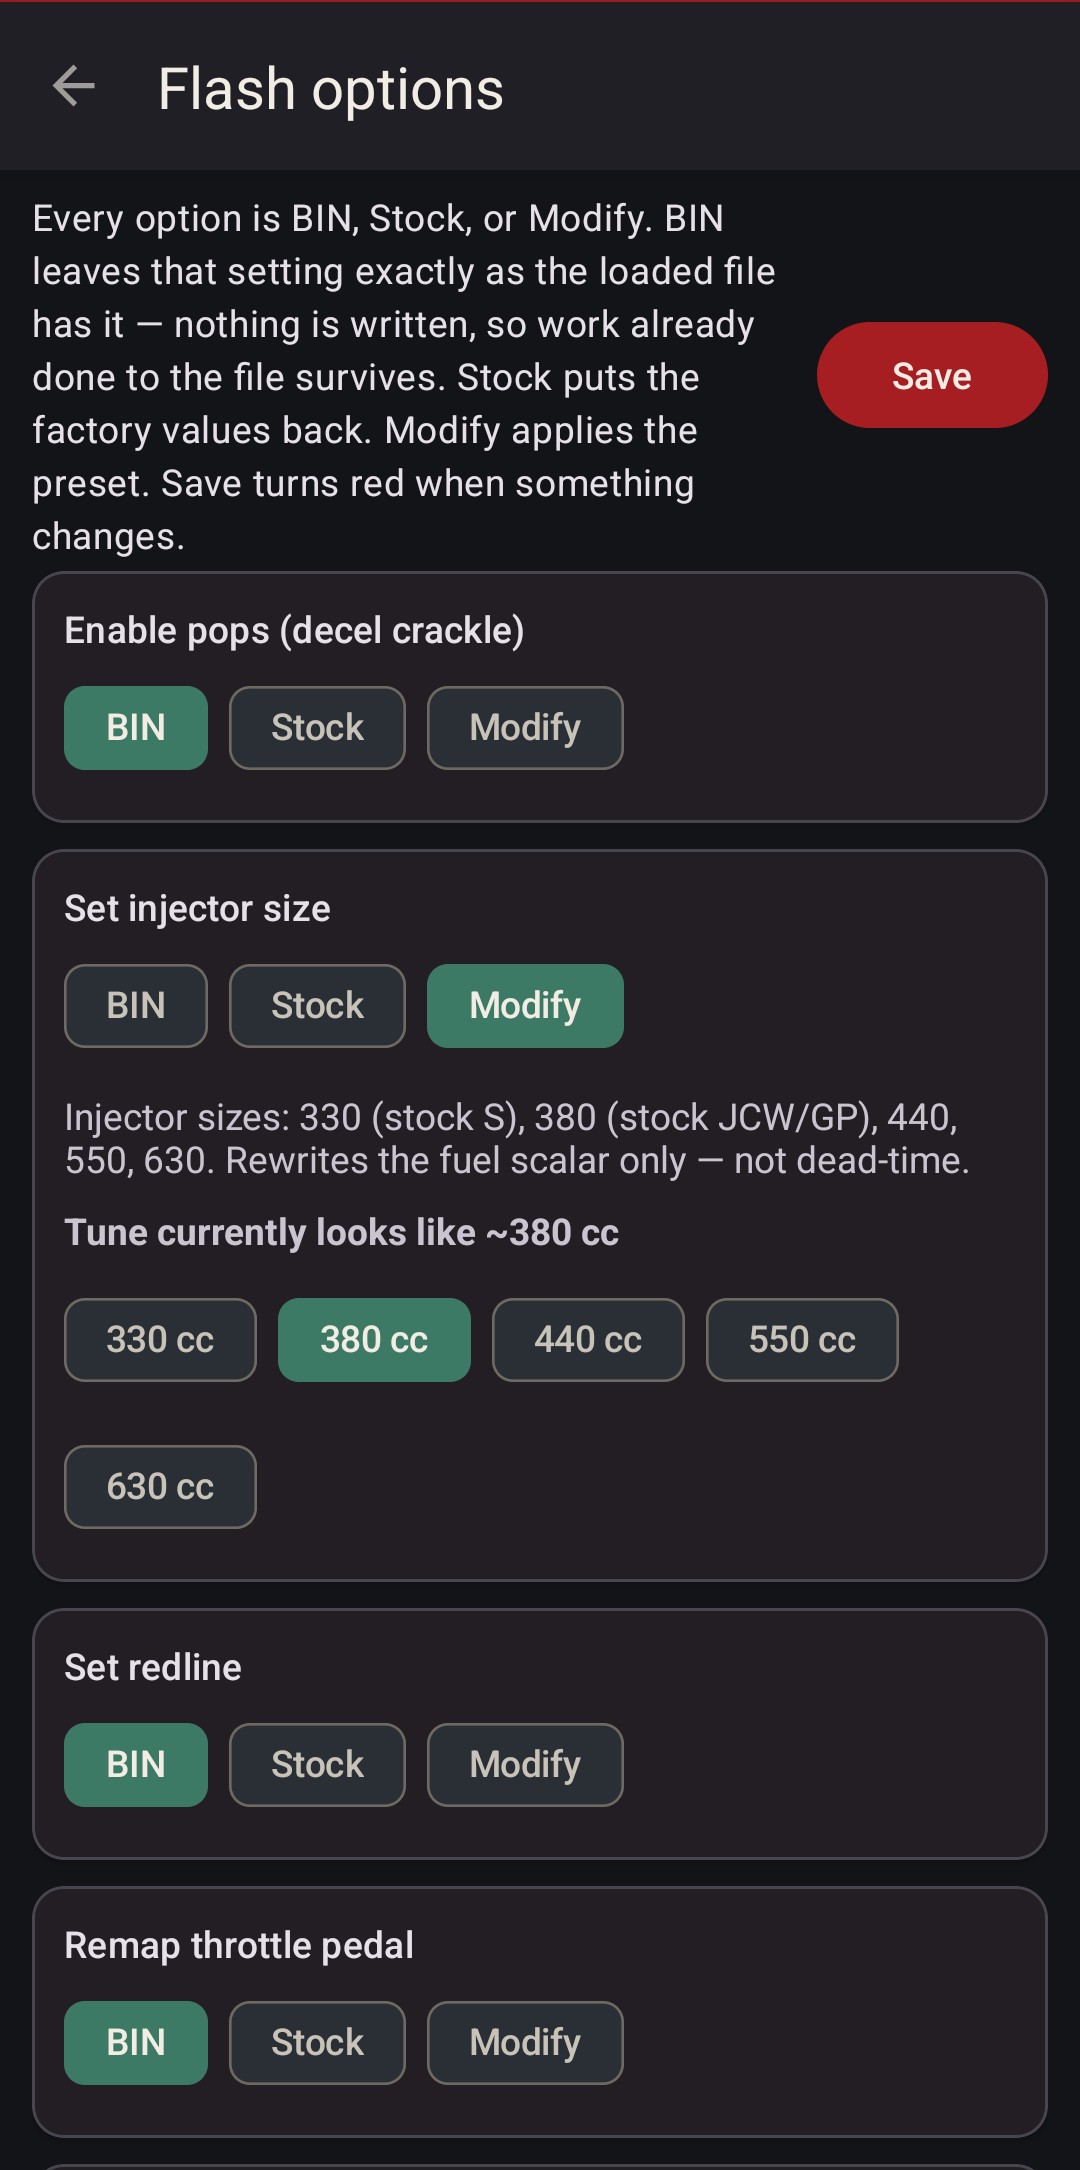
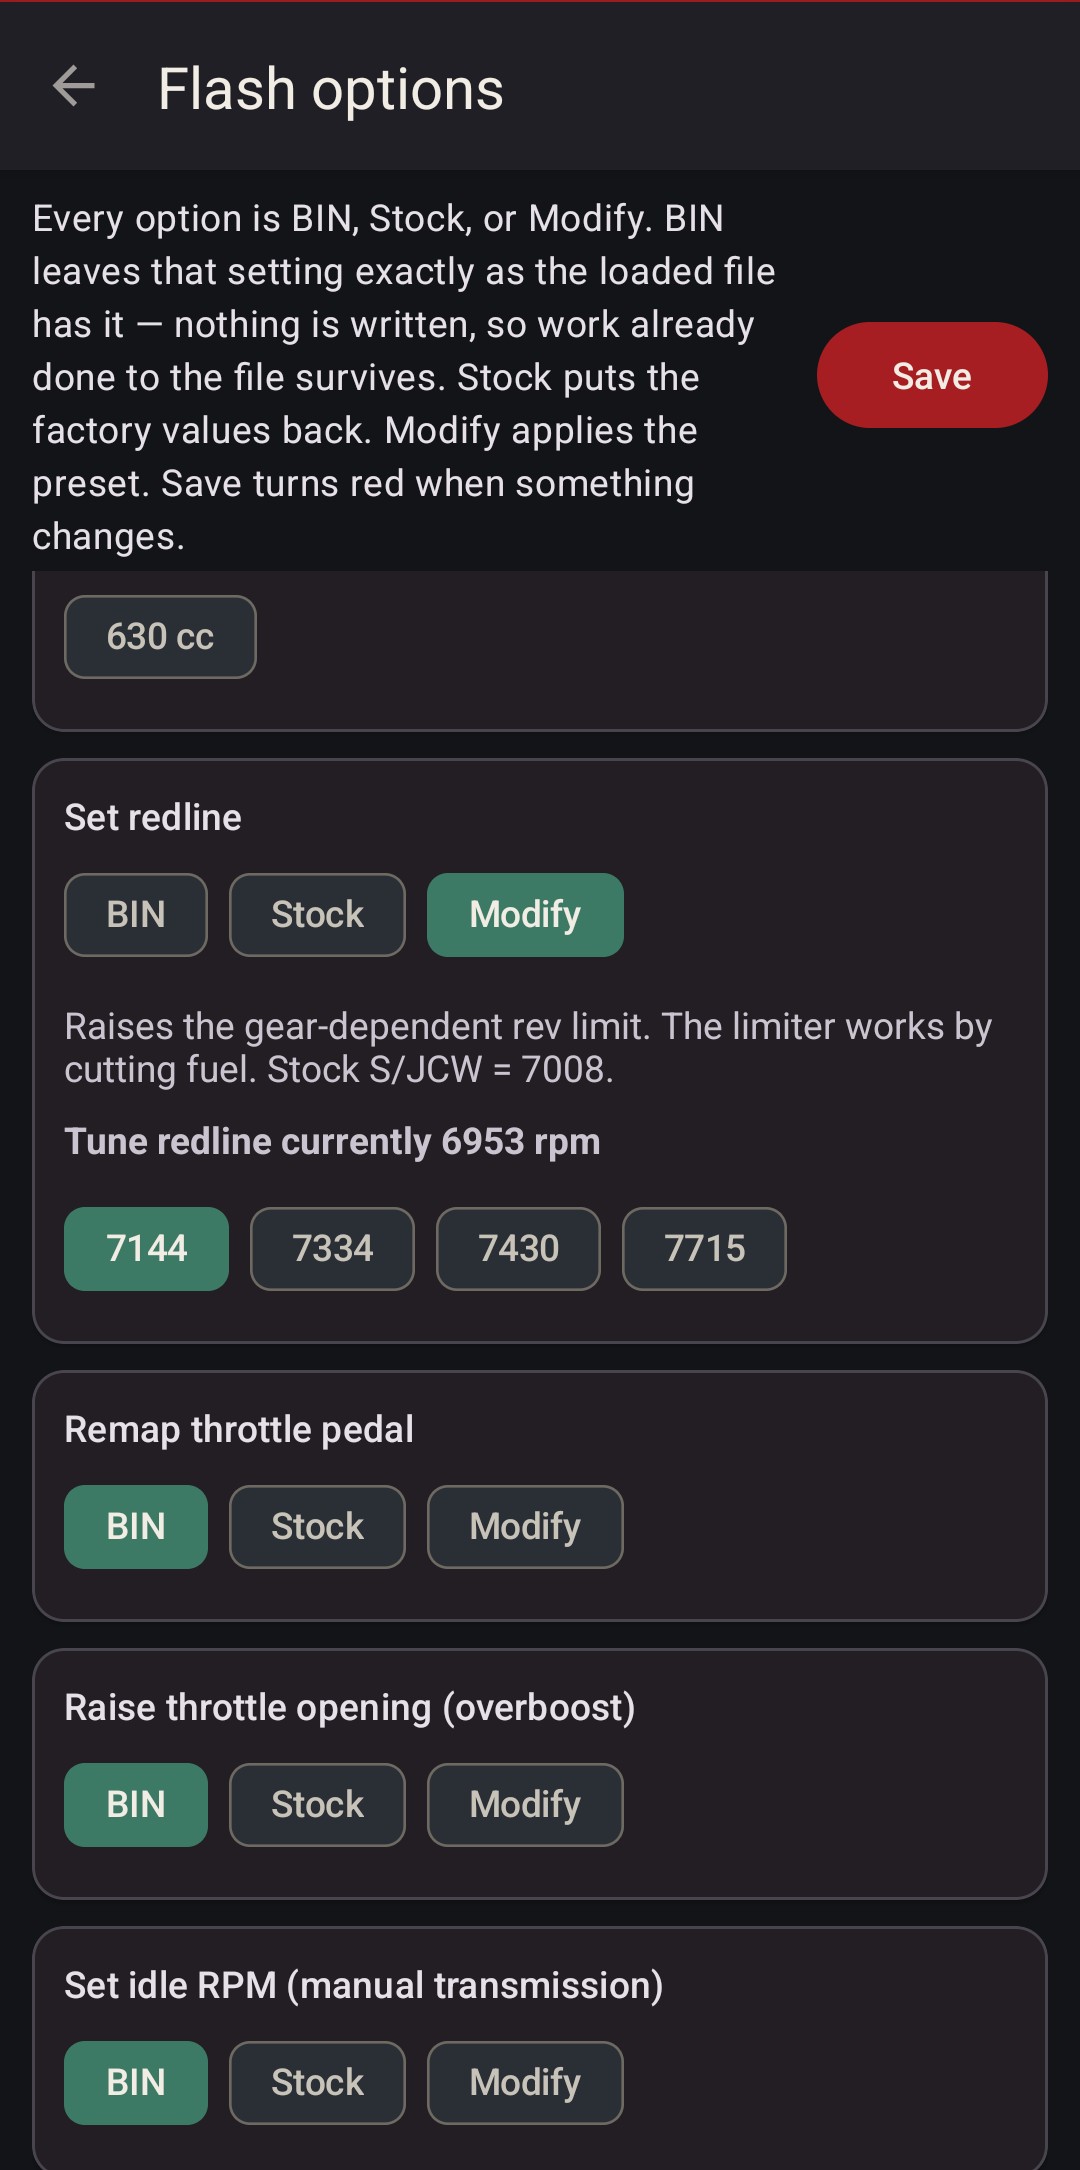
Every option is BIN (leave the file alone), Stock (factory values back) or Modify (apply the preset). Each card reads the loaded tune first: the injector card says the JCW image looks like 380 cc, the redline card shows the limit it's about to move.
If an option can't find its table in your bin, it refuses rather than guess.
Decel crackle, stock to max.
330, 380, 440, 550, 630 cc. Rescales the fuel scalar.
Raises the per-gear limit. The limiter cuts fuel, not throttle.
Eco, Sport, Sport+, a true 1:1 Straight, or Track.
Raised throttle opening.
Manual cars, cold and warm together.
Kick on earlier: 216/230 °F or 200/220 °F.
Learn fuel trims further up the revs.
About 2° more advance at light-throttle cruise, for economy.
A facelift ECU in front of the early gearbox, so it works out the right gear.
Moves the front O2 switch voltage, so cruise settles slightly lean.
Leans steady cruise. Watch AFRs and back it out if you don't like it.
What it costs
One-off in-app purchases, no subscription. The app unlock is the base, and a flash needs one of the two add-ons on top of it.
App unlock. Logging, graphs, 3D and maps, fuel recommendation and simulator, wideband, dashboards, diagnostics and the Garage.
Flash unlock. Write to the ECU, with the twelve options on whatever tune is loaded.
Stage 1 flash. MINI's JCW and GP1, Stage 0, and stock S to go back. Writes them on its own, no Flash unlock needed.
- Log, tune views and diagnostics: $25.
- Flash Stage 1 or Stage 0: $75, the app unlock plus Stage 1.
- Flash the options on your own tune: $75, the app unlock plus Flash unlock.
- Stage 1 with options on top: $125, all three.
- Free: reading your ECU's full backup and sending it to me, so an ECU the app doesn't support yet can be checked before you buy anything.
Prepared facelift ECU, $275. VIN-swapped to your car with the immobiliser deleted, ready to drop in. Shipping at cost. Email matt@geekopolis.com with your year, model and VIN.
What you need
An Android phone or tablet, a K+DCAN USB cable and a USB-C OTG adapter. That's the best setup, and the one every flash so far has gone through.
The BMW diagnostic cable, around $25. Get one with the 7/8 switch and an FT232RL (FTDI) chip, which is what every flash so far has used. Find one on Amazon.
USB-C plug to a full-size USB-A socket. The cable plugs into it, it plugs into the phone, and Android offers to open the app. I use the JSAUX two-pack, under $10. Find it on Amazon.
Android 7 or newer with USB-C. A tablet on the dash also runs the six dashboards.
Set the cable's switch to link pins 7 and 8. The engine talks on pin 7. The cluster and the other body modules are on pin 8, and the app reads the VIN from the cluster to file everything under the right car. With pin 8 off, logging still works, but the VIN read and the body module diagnostics don't.
Flash with the cable, the car on a battery charger, key on and engine off.
Two other ways onto the K-line:
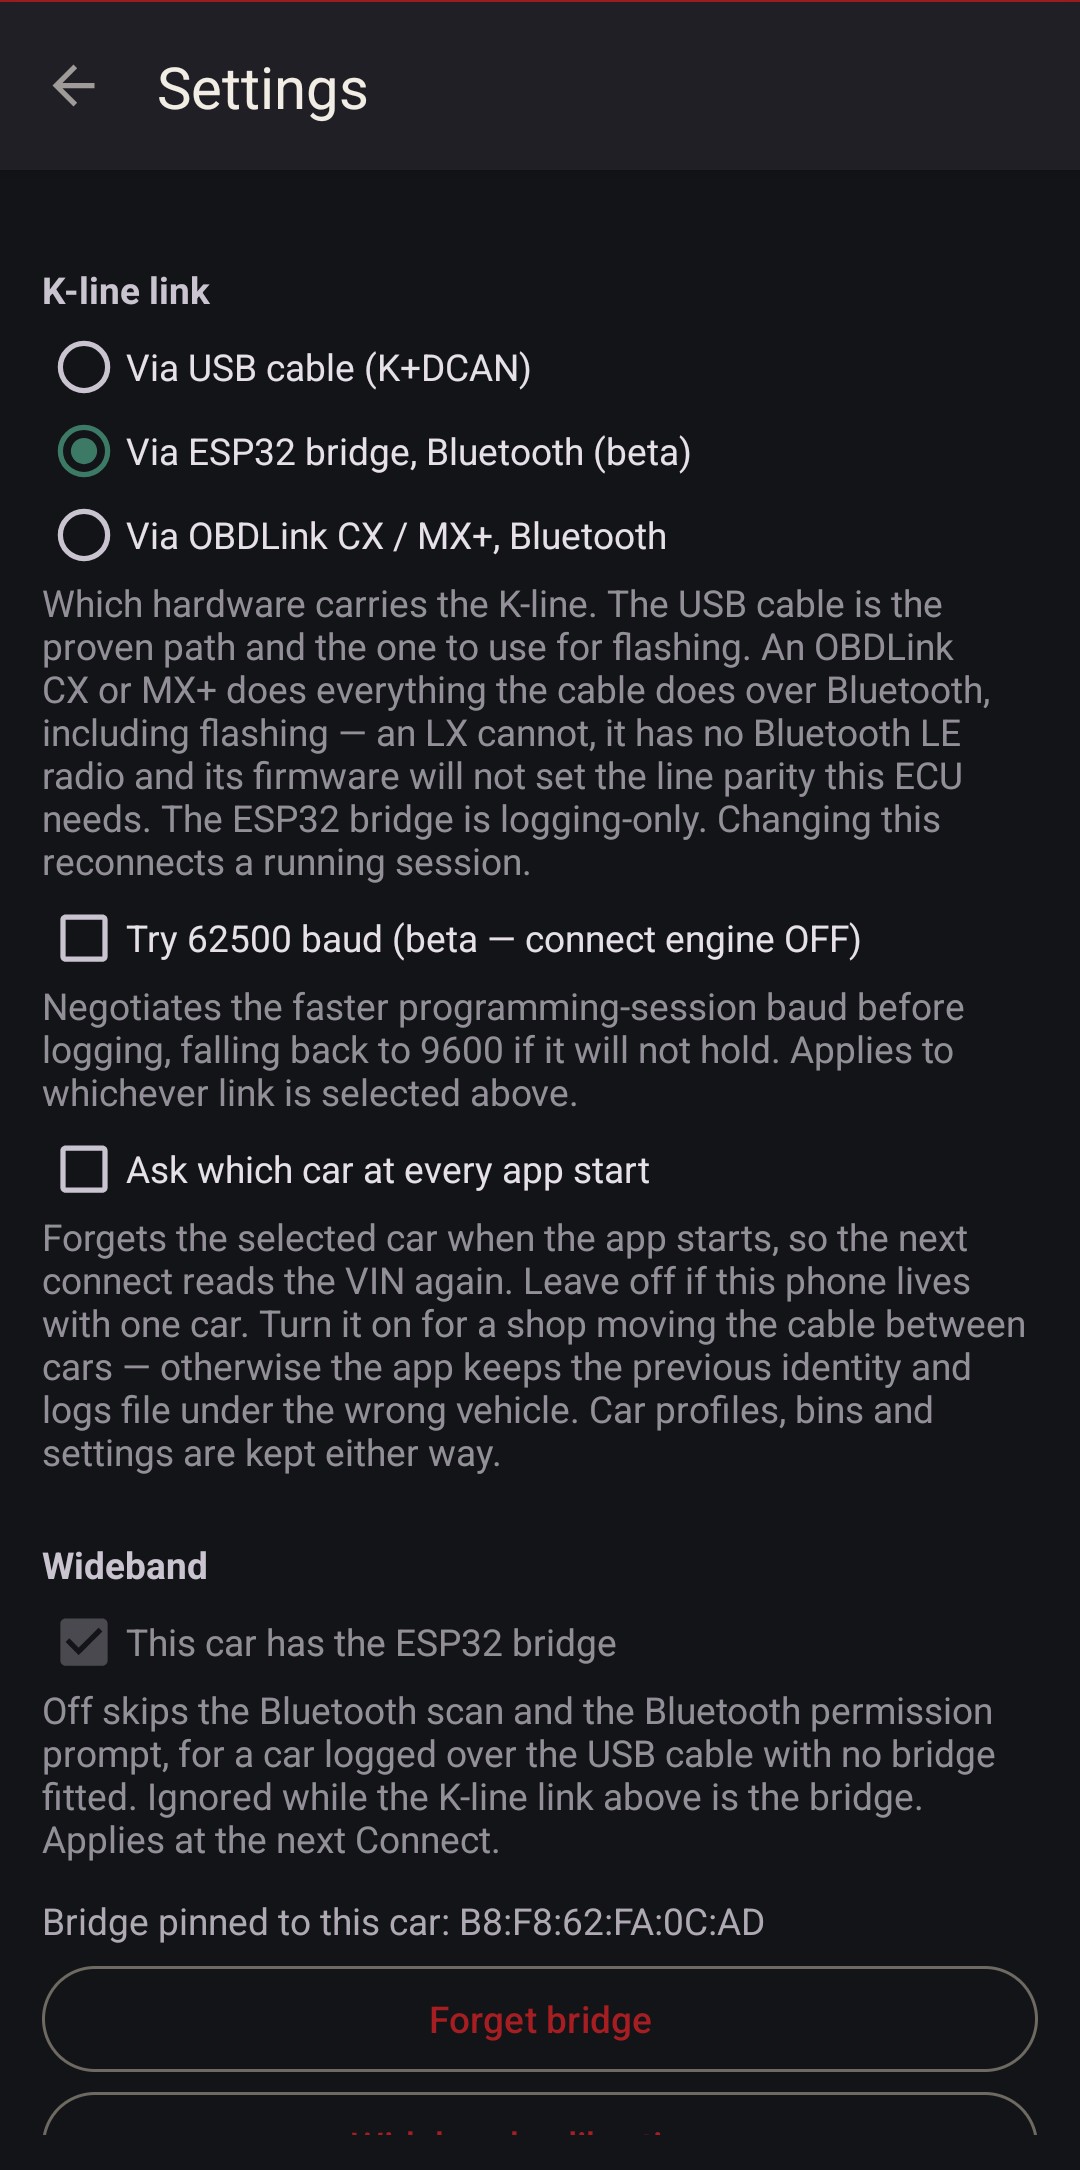
- OBDLink CX or MX+ over Bluetooth. Logging, diagnostics and flashing, no cable. It only reaches pin 7, so name the car by hand. An LX won't work: it has no Bluetooth LE and can't set the parity this ECU needs.
- ESP32 bridge (optional). Adds CAN channels and an AEM wideband over AEMnet, and can carry the K-line for logging.
What it can and can't do
It flashes factory calibrations with options on top, and it logs an R53 well enough to show where a tune misses. It doesn't write a custom tune, and it doesn't code modules.
- Flash MINI's JCW or GP1 (Stage 1), the first JCW kit's software (Stage 0, any manual Cooper S), or stock S, with the options on top.
- Back up the whole 512 KB ECU before it writes anything.
- Log the ECU at about eight time-aligned rows a second, plus a wideband over the bridge.
- Show where the tune misses: AFR and spark in 3D and on cell maps, with knock pinned to the cell.
- Propose fuel changes from a log, and simulate them against it.
- Read fault codes from the engine, body, EWS, cluster, ABS and airbag in plain English, clear them, and reset adaptations.
- Run six dashboards on a tablet.
- Write a custom tune. Stage 1 is MINI's factory calibration. A custom tune, with raised torque and air tables and more advance, makes more power.
- Flash the fuel changes it proposes. They export as CSV for your tuner. Nothing in the simulator touches the bin.
- Run Stage 1 on stock 330 cc injectors. It needs 380s. A pulley on stock injectors is what Stage 0 is for.
- Put Stage 0 on an automatic or a base Cooper, or over JCW or GP1, which already go further.
- Flash Stage 1 on a
740R10automatic yet. The app reads which automatic software you have from the backup. - Flash ECU software it doesn't support yet. It still reads the backup, and Send gets it to me to port.
- Code modules like the body computer, EWS or airbag. That's R53 Coding, a separate app.
- Connect through an OBDLink LX.
Which ECUs it flashes
Facelift, silver cover. Stage 1, Stage 0, stock S and every option. Automatics on this software get their own JCW and GP1.
Early ECU and pre-facelift conversions. Stage 1, Stage 0, stock S and every option.
Early ECU. Stage 1 ported from the factory's changes, Stage 0, stock S and every option.
EU Cooper S. JCW and GP1 ported from the factory's changes, Stage 0 and every option. Back to stock from your own backup.
Cooper S. Stage 0 and every option. There's no Stage 1 image for it.
Automatic, on different software from the 740P10 automatics. Stage 1 and Stage 0 aren't supported on it yet. It backs up, logs and reads codes, and fan and redline are the only options it writes.
Logging, live data, diagnostics and backup work on any R53 EMS2000, silver cover or black.
Why it's safe to flash
It reads before it writes, it checks everything it can, and when it isn't sure it stops.
A full 512 KB read of your own ECU, kept per car in the Garage.
Checksums and layout verified before every write, auto-fixed where it can be.
A file for other ECU software is refused outright, with no override.
Only the calibration region, about 60 KB, over OBD.
The write runs in the background and nothing else can take the cable.
If a write stops, one tap sends me the log that says where and why.
It's writing a twenty-year-old ECU. Keep the car on a battery charger, key on and engine off, and keep a desktop OBD recovery path ready.
Log it
Plug in, connect, and the car streams fast enough to catch what happens mid-pull, time-aligned so RPM, load and knock line up.
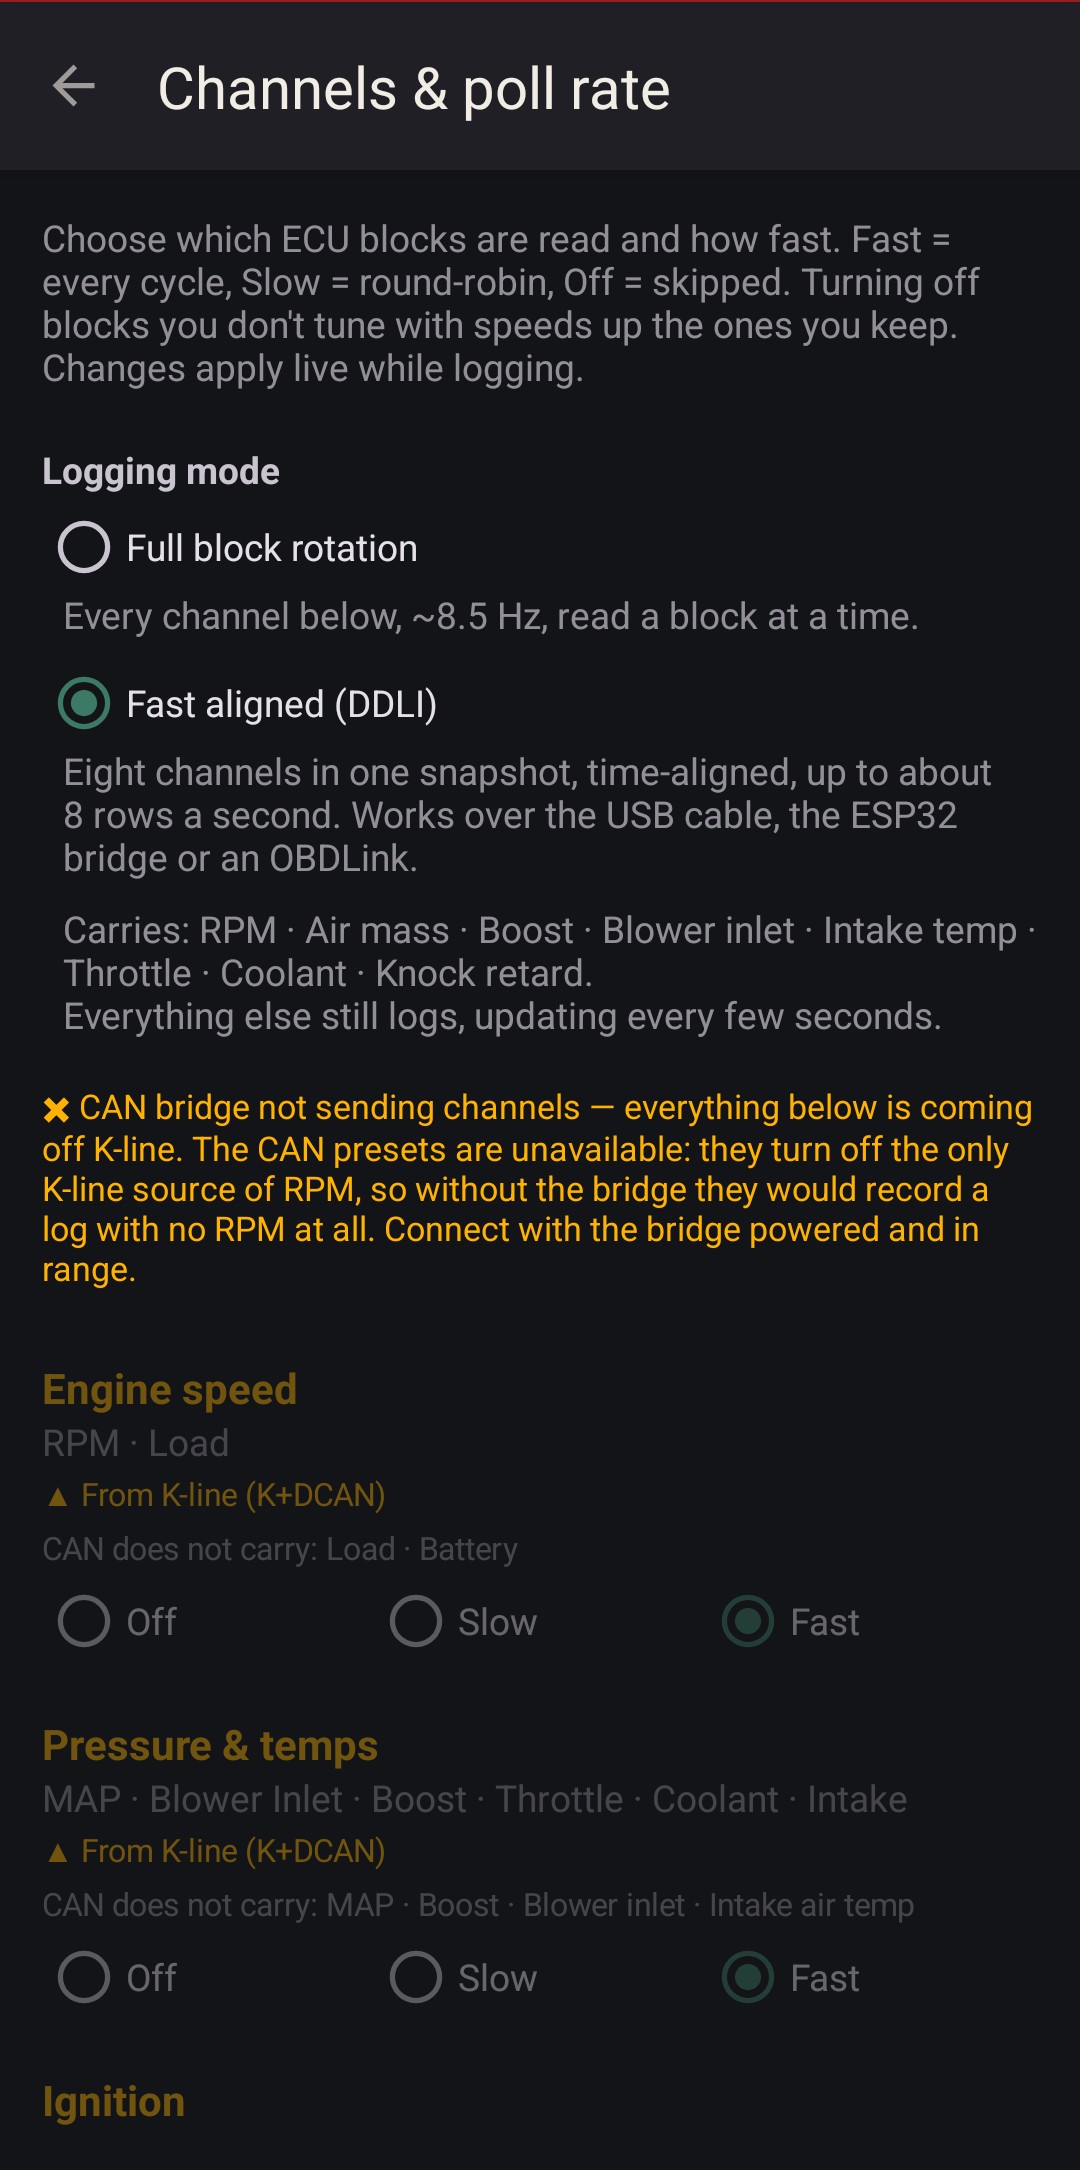
Fast aligned mode is the default. The ECU hands over RPM, air mass, boost, blower inlet, intake temp, throttle, coolant and knock retard in one snapshot, up to about eight rows a second. Every channel in a row comes from the same instant, so a knock reading sits on the RPM and load it happened at.
Everything else still logs: spark per cylinder, knock level and energy, trims, injector time and duty. Set each block Fast, Slow or Off and spend the K-line on what you're tuning.
A wideband joins over the ESP32 bridge and lands in the same CSV. Logs share as plain CSV or straight to Datazap.
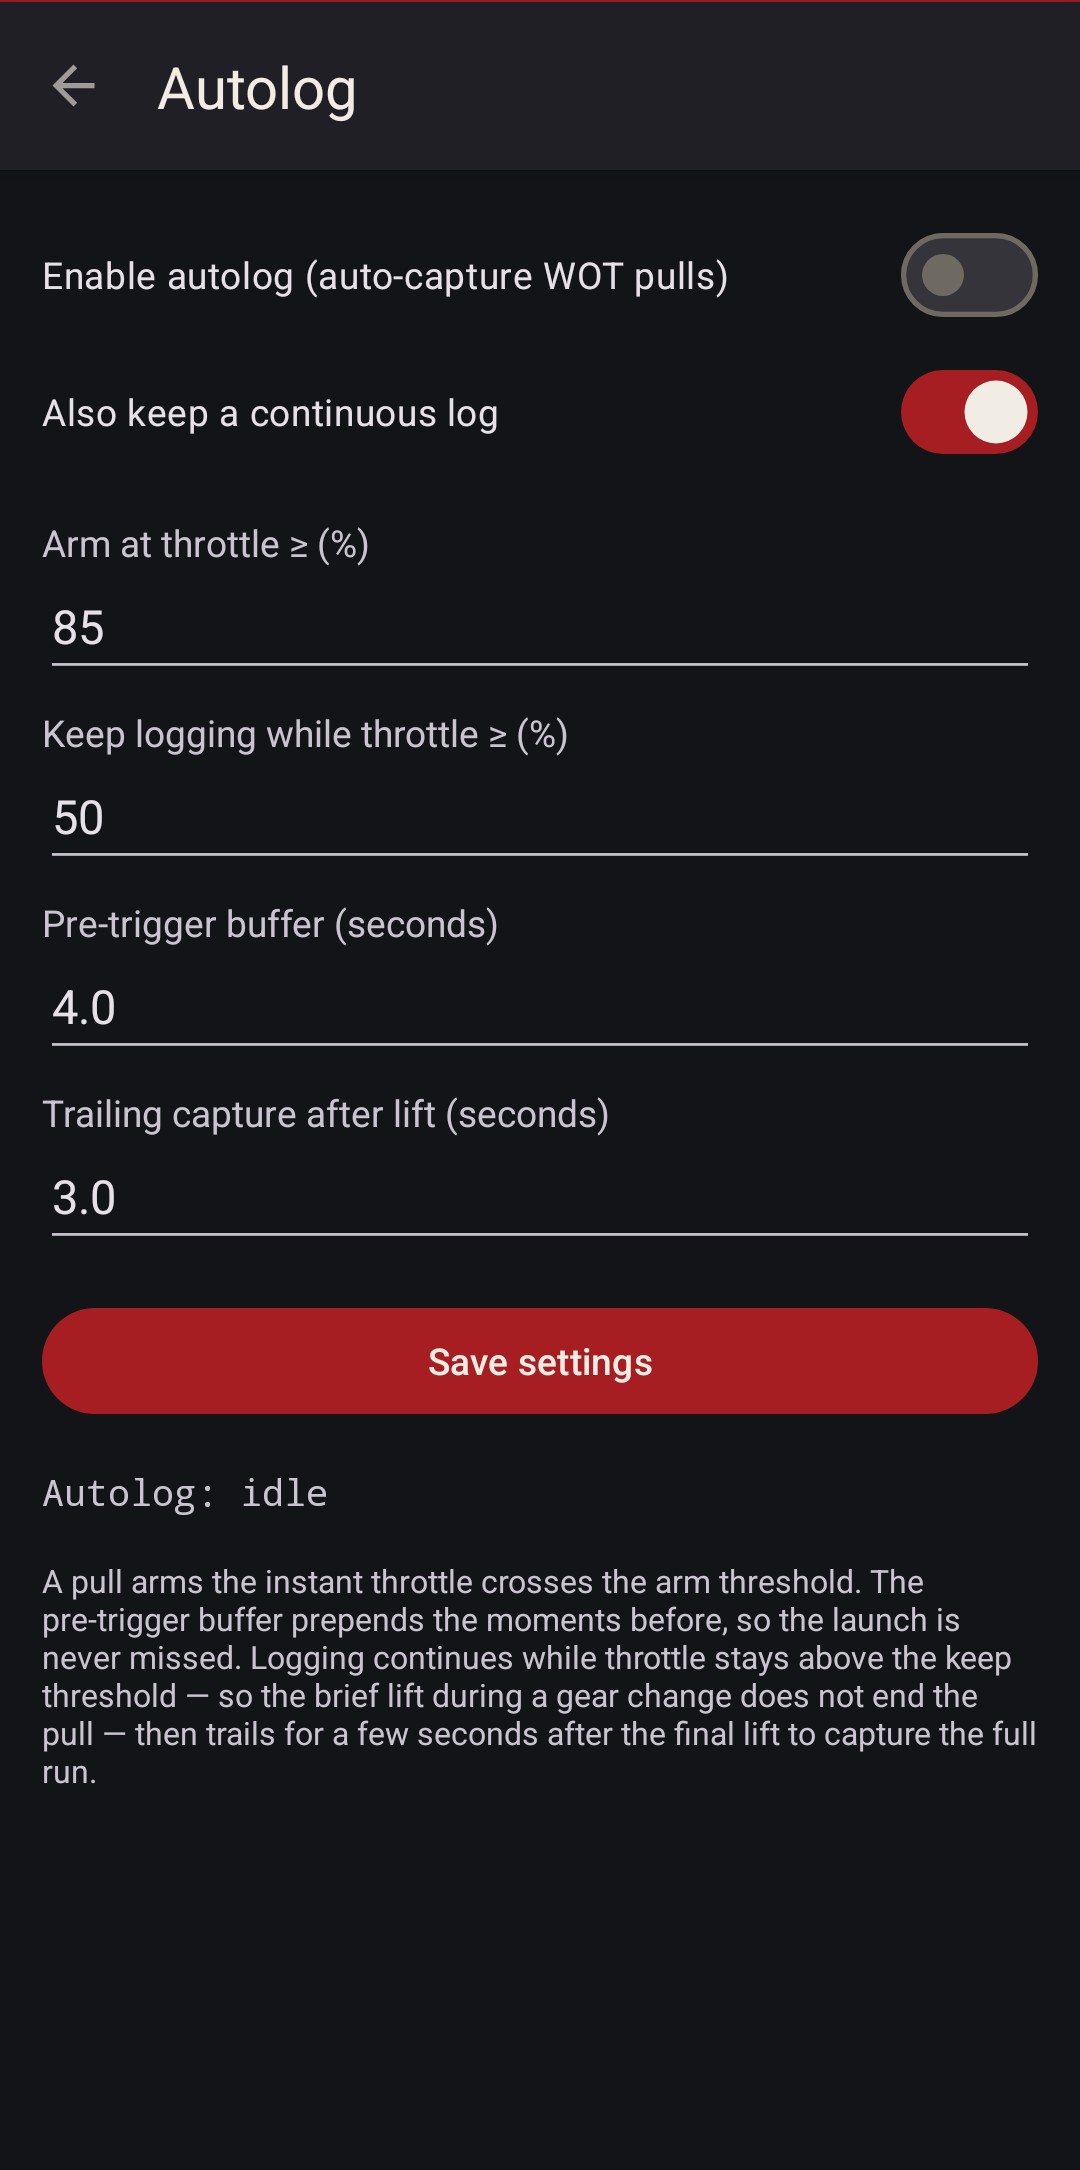
Autolog records the pulls for you. It arms when throttle crosses your threshold, and a pre-trigger buffer keeps the seconds before it, so the launch is never clipped.
A lift between gears doesn't end the run. It trails a few seconds after the last lift, then saves the pull as its own file. Drive the car, and every pull is waiting when you stop.
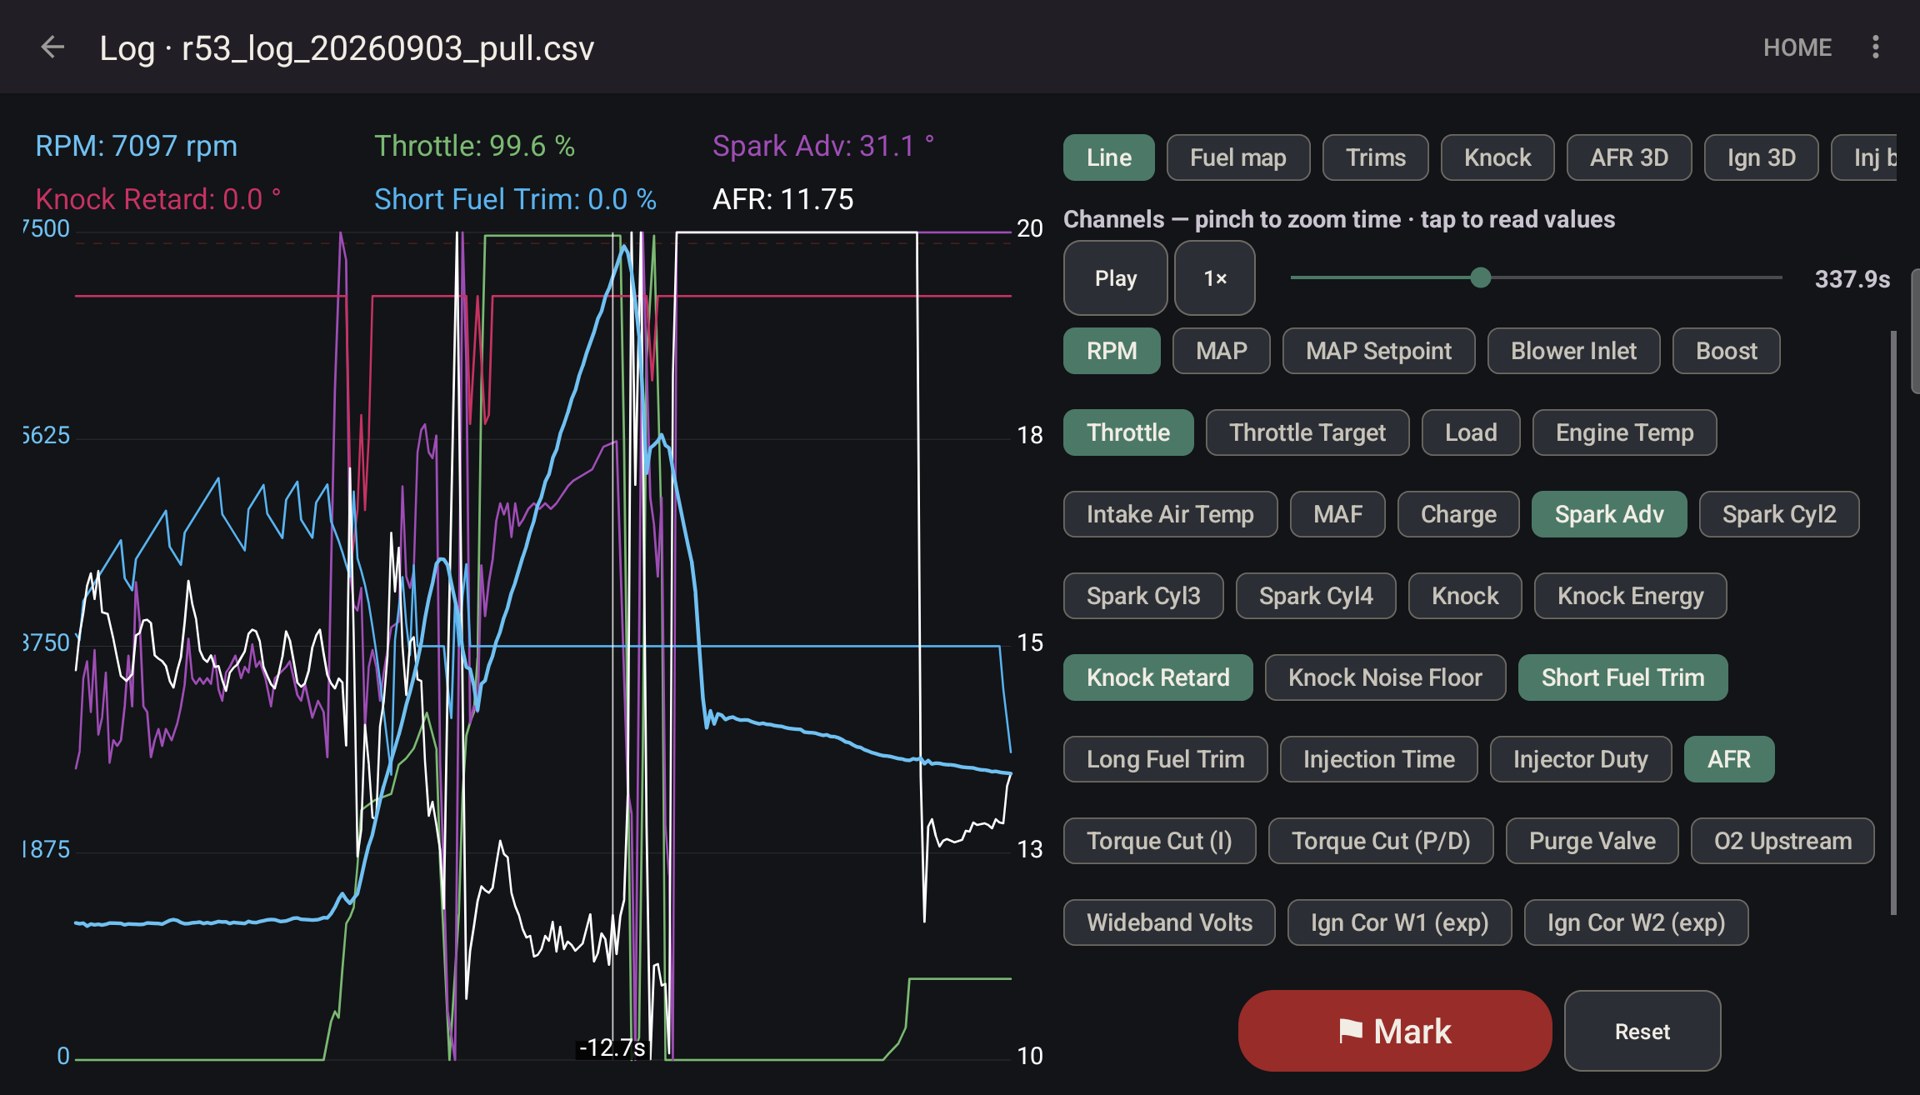
The graph is a playback deck. Replay any log at 1× to 4×, pinch to zoom time, tap to read every value at that instant, drop marks, and toggle channels. It works live too, with a stale-data banner the moment the ECU stops answering.
On a tablet in landscape it goes two columns, chart on the left and controls on the right.
See the tune
The same log plays back as a 3D surface and as flat maps over RPM and load, so you see where the tune misses, not just when.
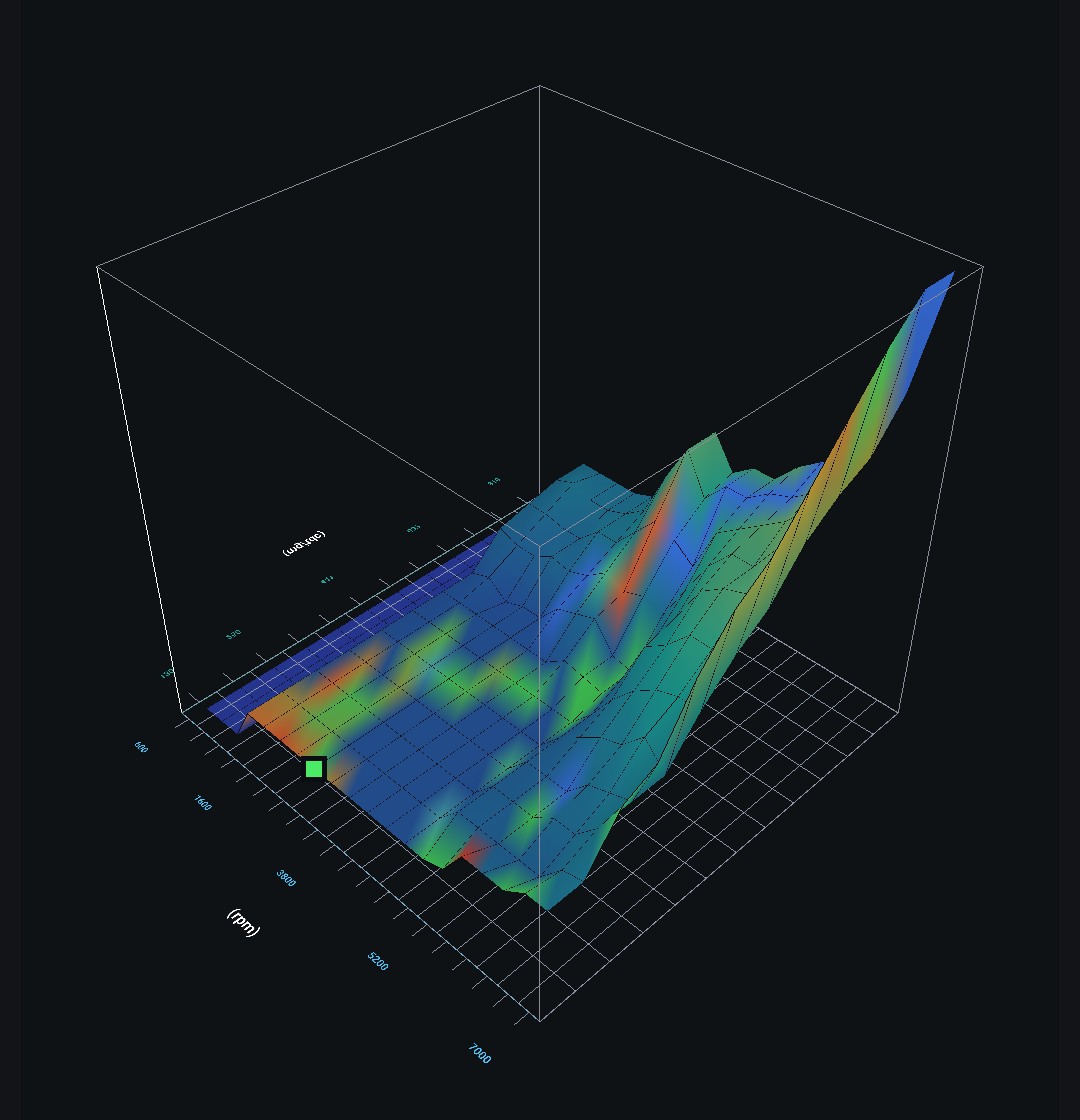
AFR 3D plots measured AFR against the target curve you set, over every cell the engine visited. Open loop shows AFR error, closed loop shows total trim. DFCO and tip-out leans are ignored, so you're reading combustion, not decel noise.
The target is two points with a straight line between them, for example 12.8 at 2,000 rpm down to 11.5 at 7,800. A wideband lag setting shifts the AFR trace so each reading lands on the cell that fuelled it.
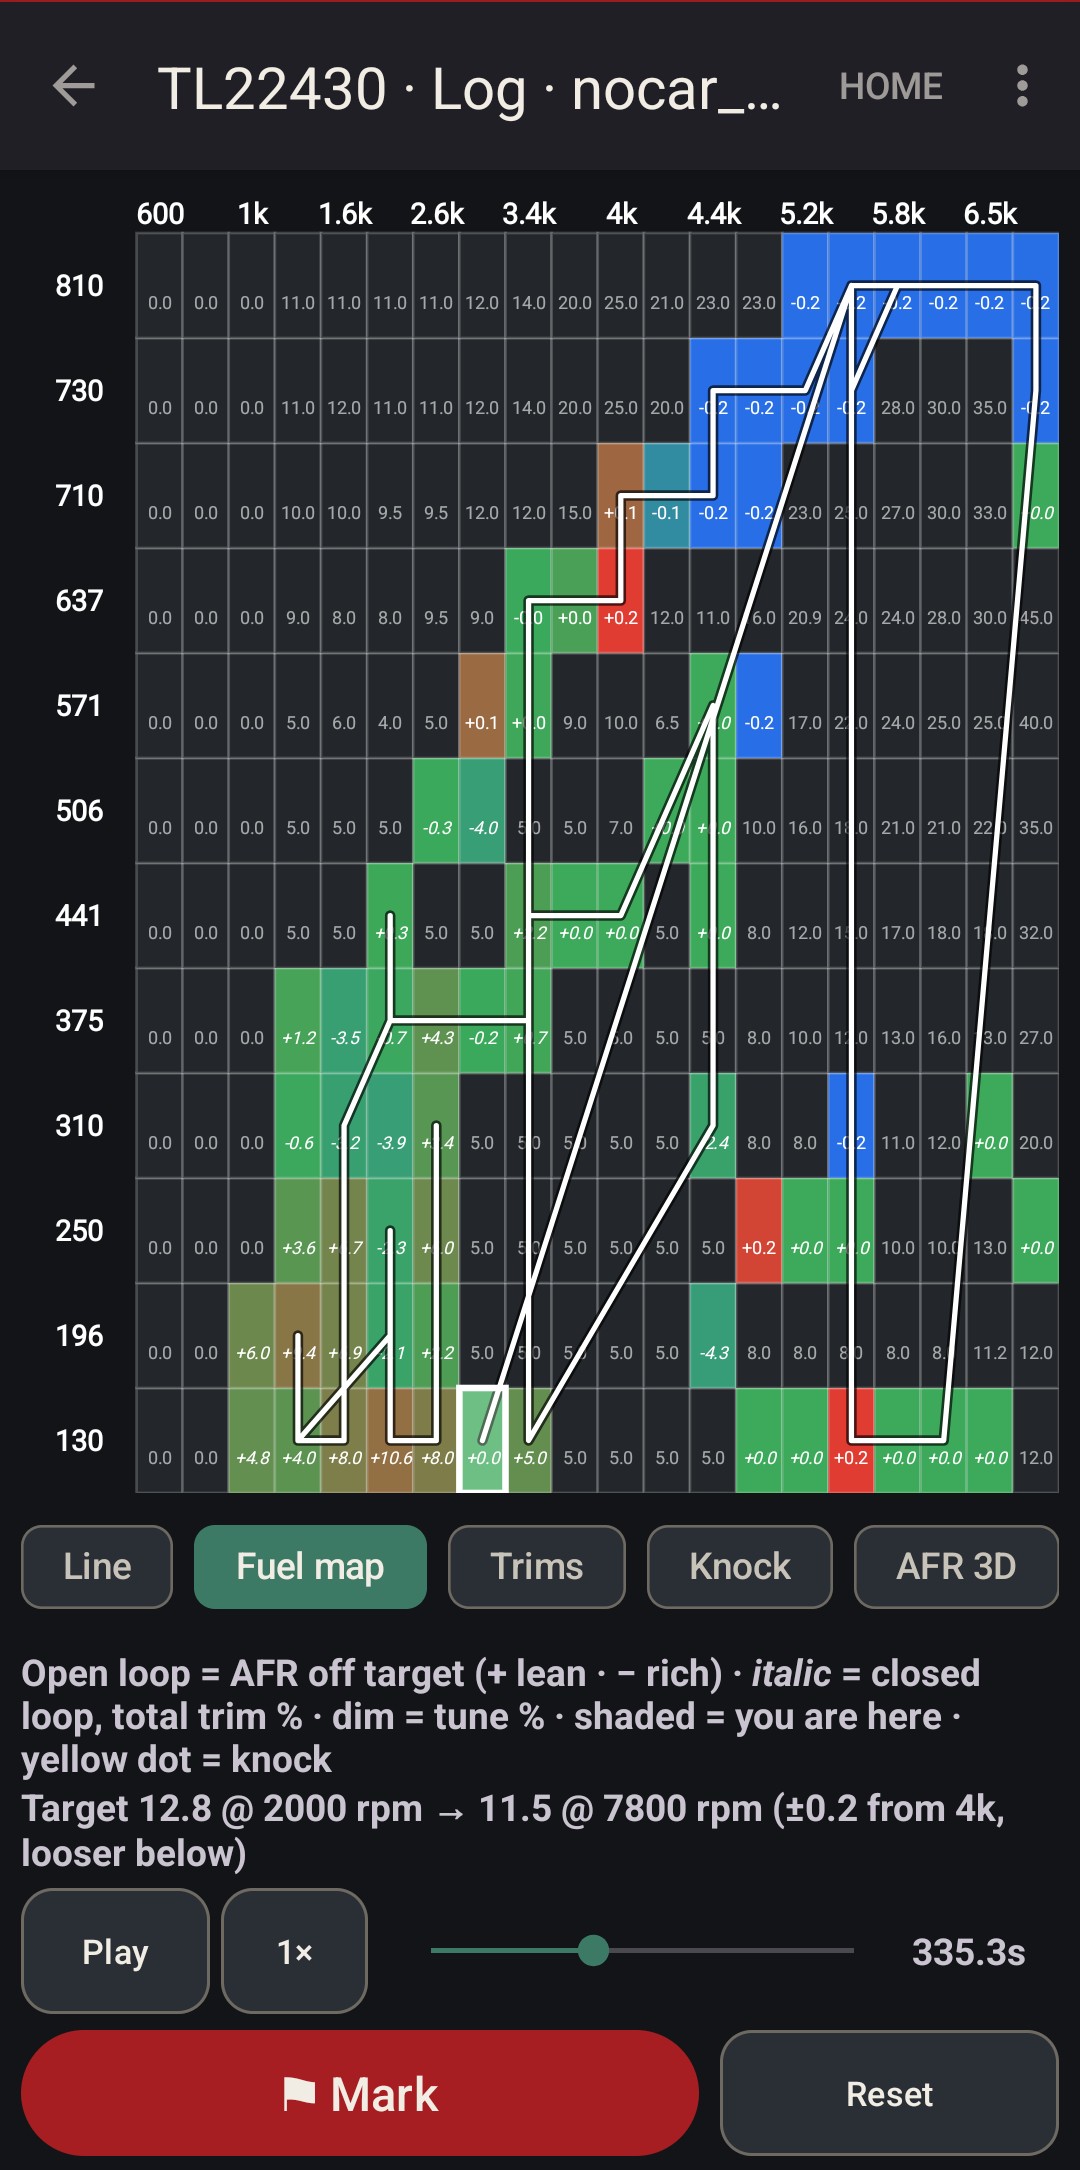
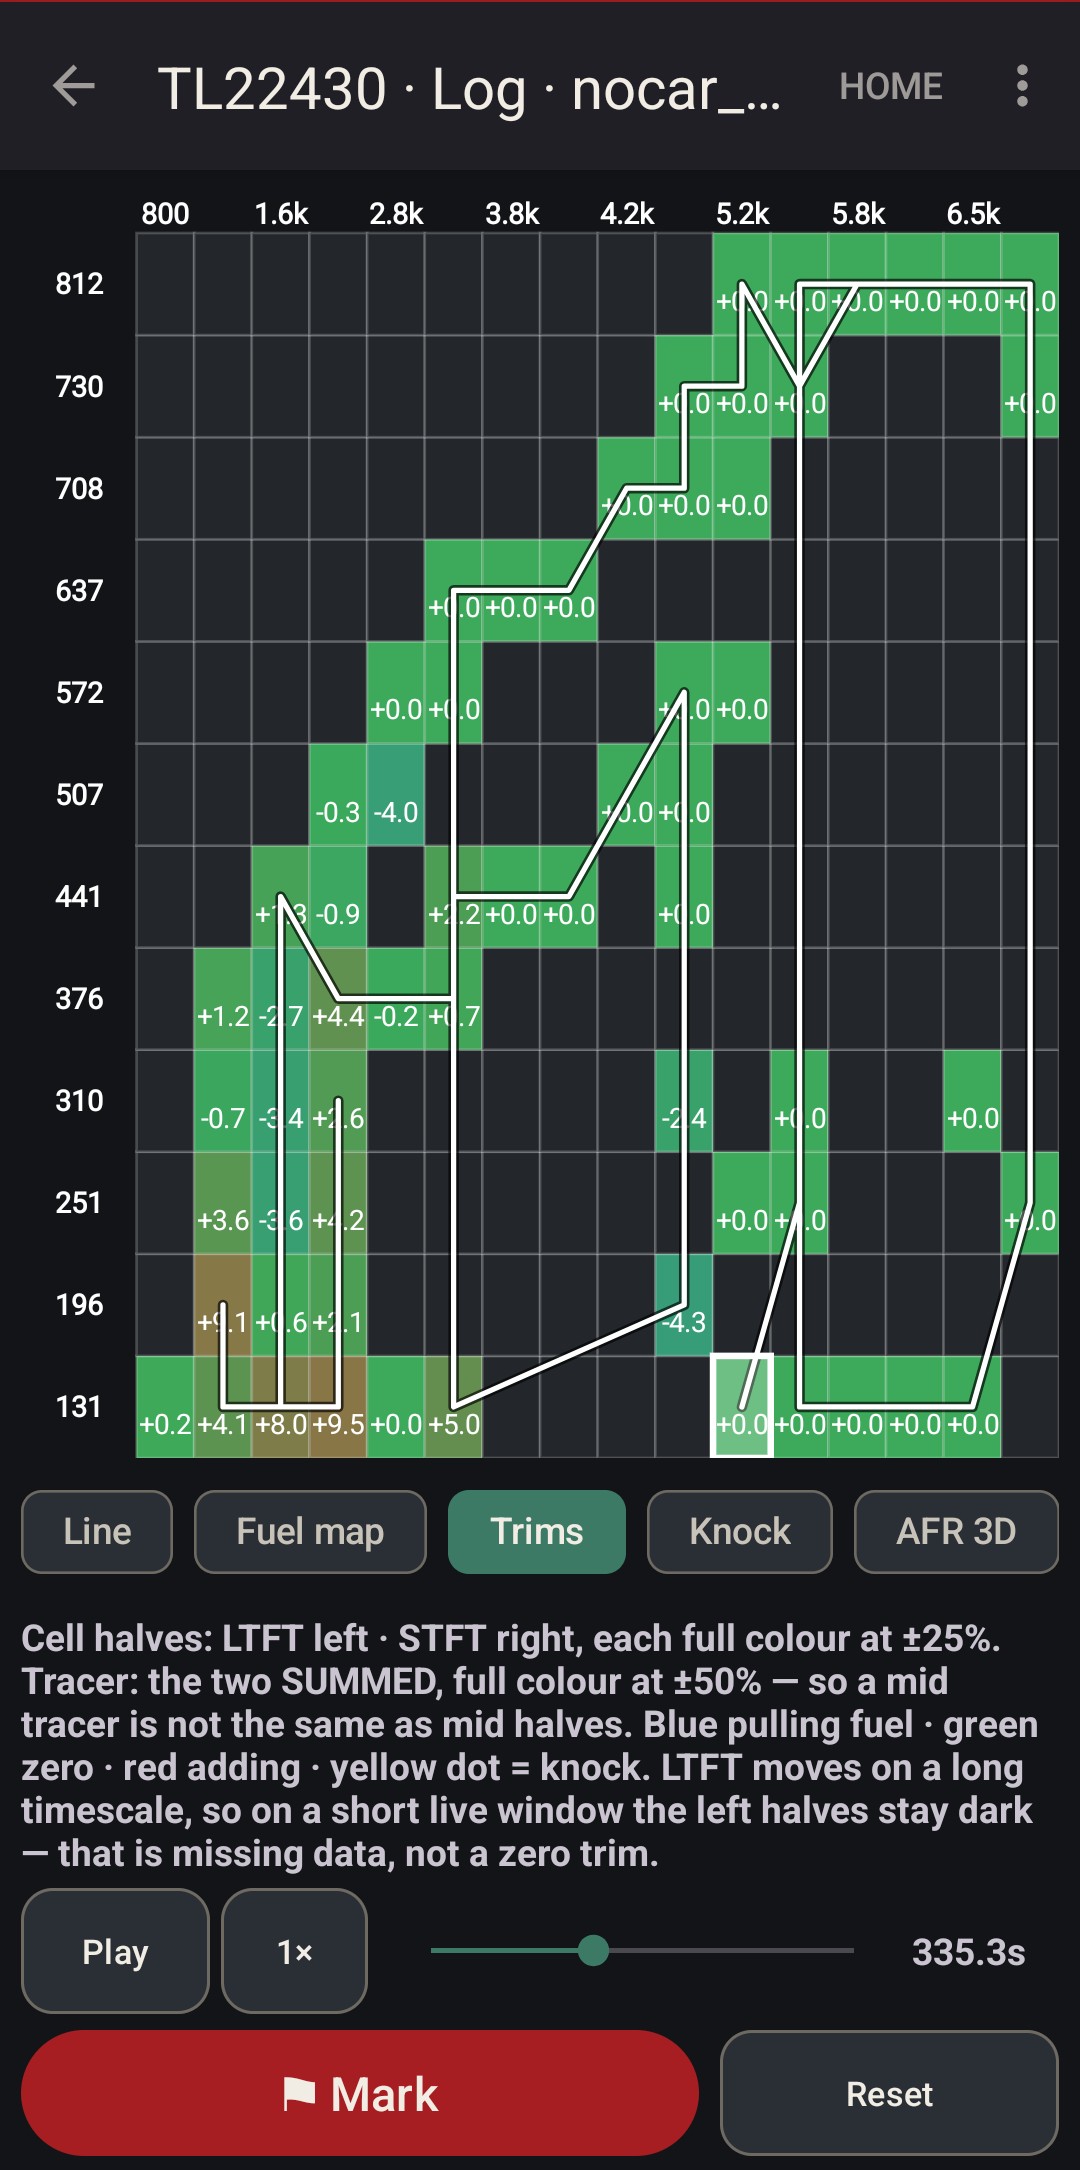
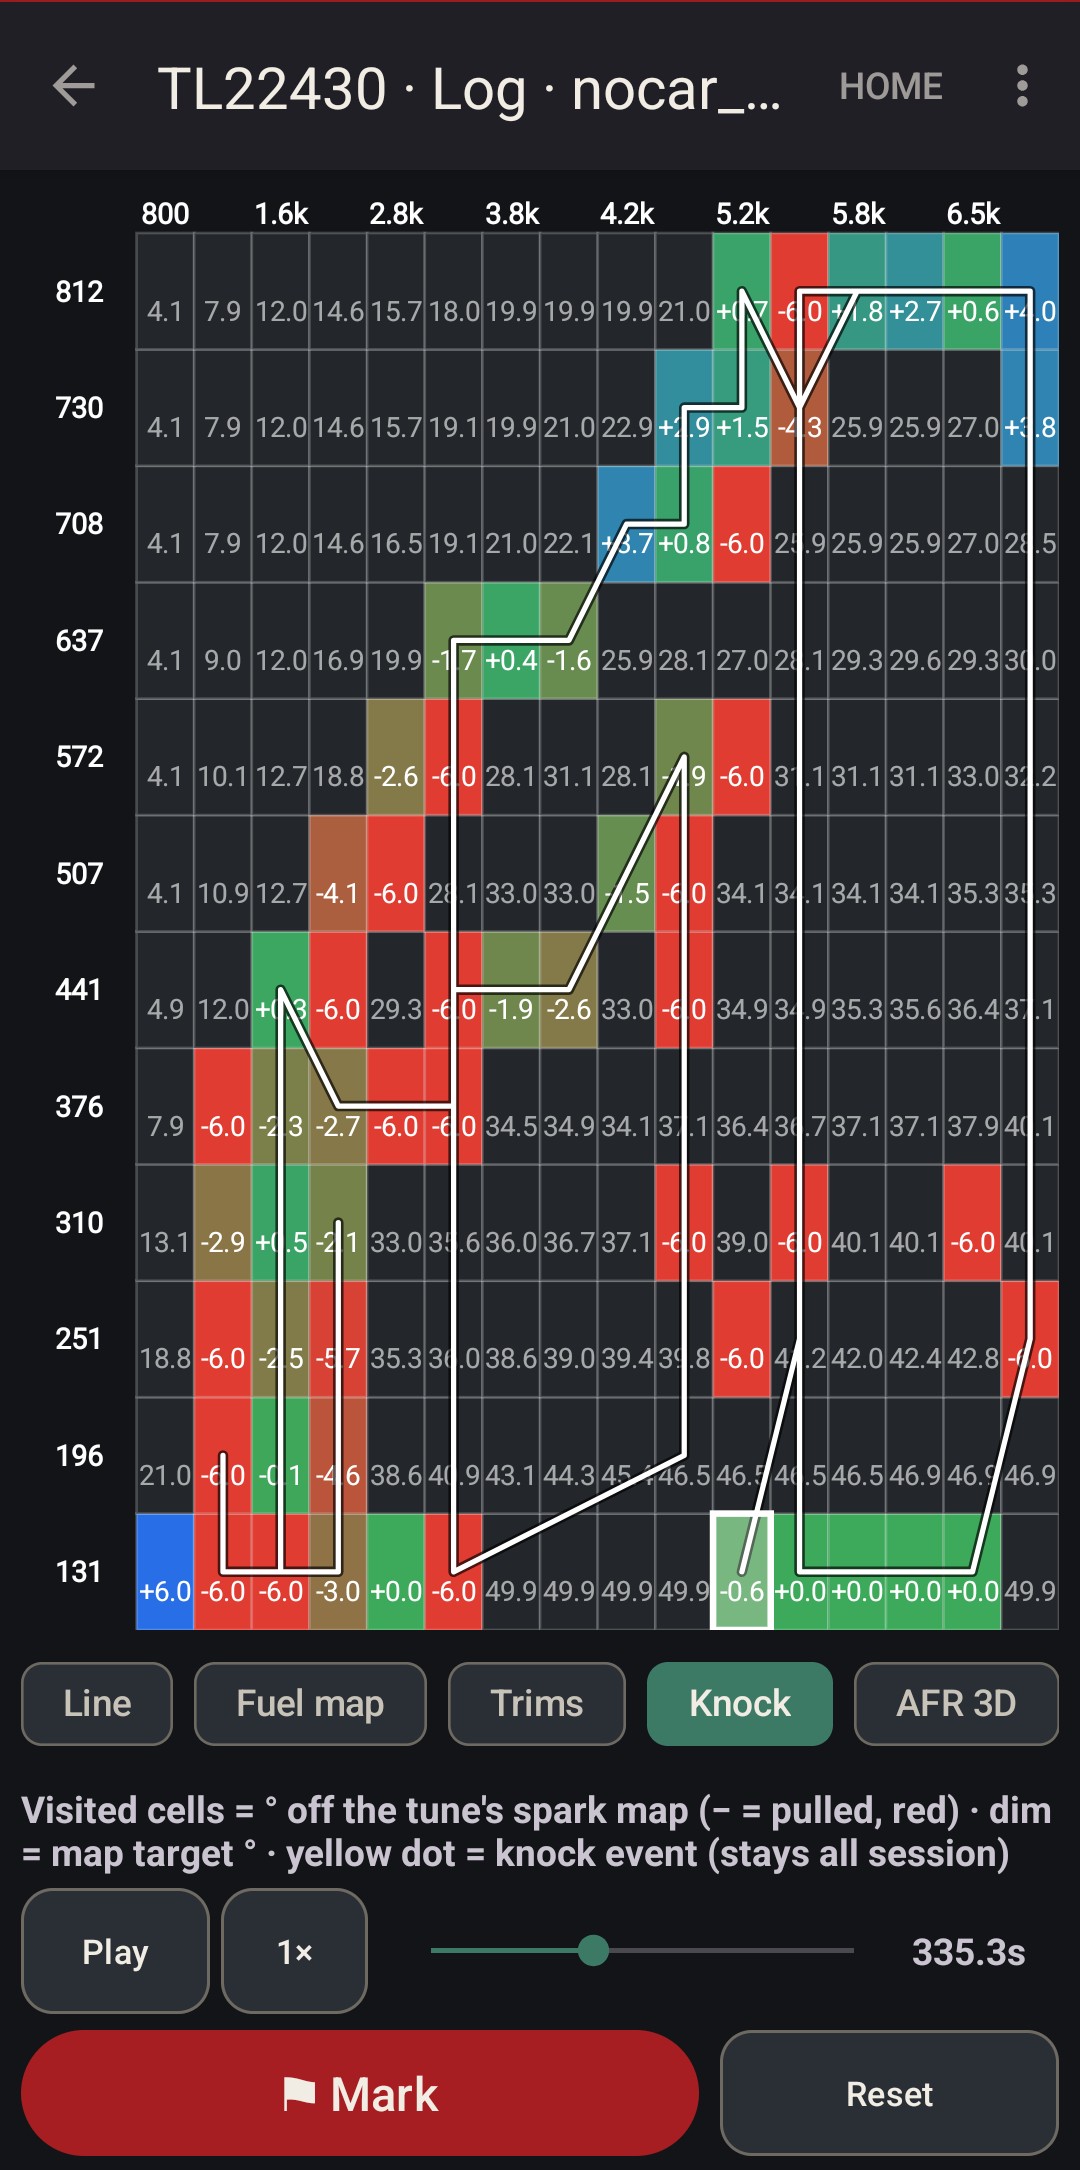
Knock, pinned to the cell that pinged. The spark map reads each visited cell in degrees off the tune's own table, and turns red where the ECU pulled timing. Every view drops a yellow dot where a knock event fired, and the dots stay all session.
A per-cylinder tally sits in the corner, so one cylinder doing all the complaining is obvious. Red cells stacked with knock dots are the corner of the map that needs work.
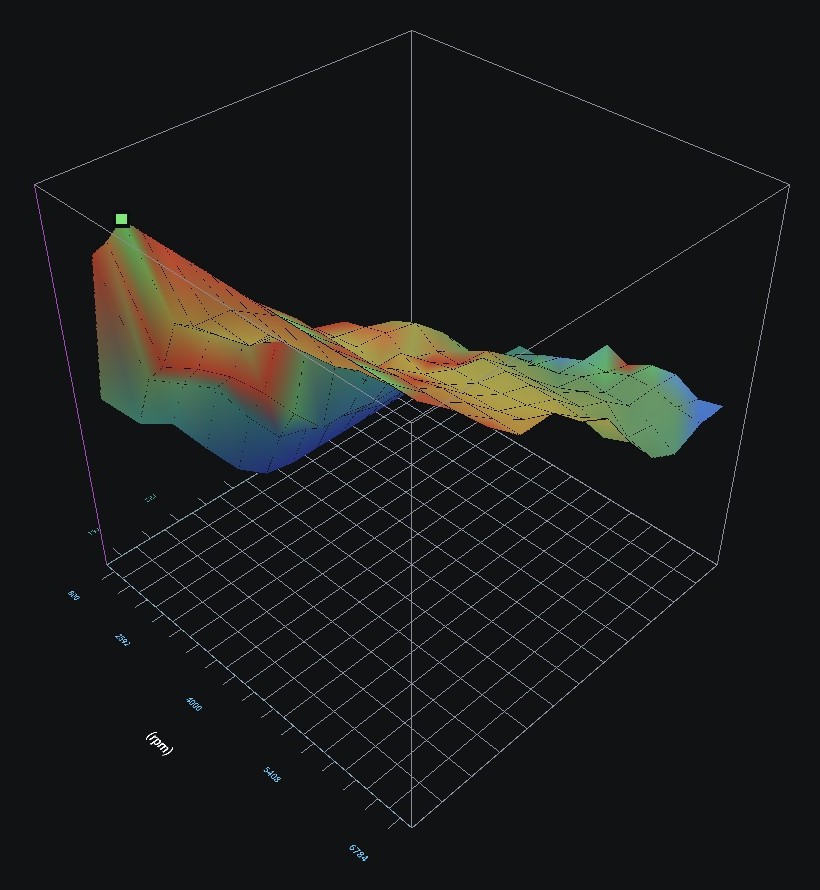
Ign 3D draws the tune's spark map as a surface and colours it by the spark the engine really got. Blue ran behind the map, green on it, red ahead. Drag to orbit.
Where the surface goes blue under load, the ECU was pulling timing there. Cross-check it against the knock dots on the flat maps.
Fuel recommendation
Log a pull, let the app turn it into proposed cell changes, and check them against the log before they go to your tuner.
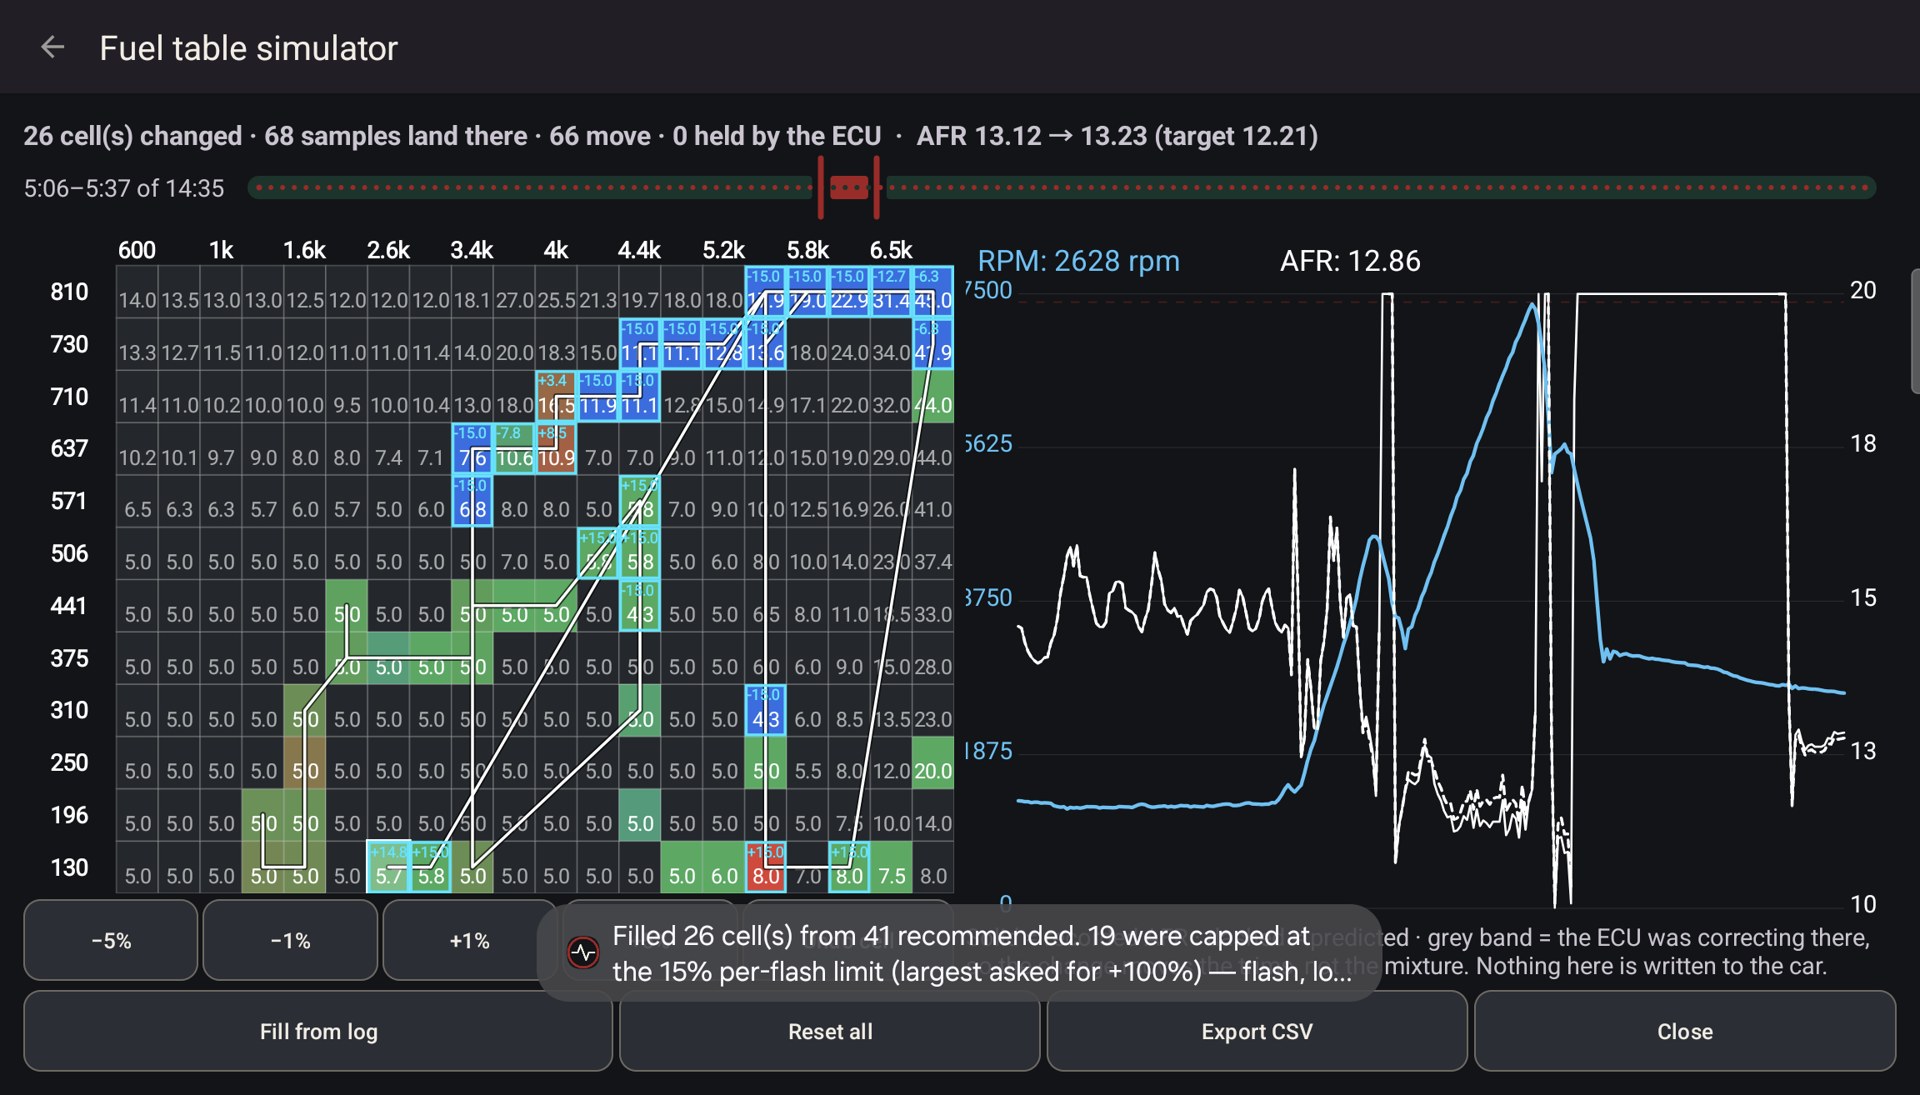
Fuel recommendation turns the window you're looking at into a per-cell table of proposed changes. Open loop is judged by the wideband against your target. Closed loop is judged by short plus long trim, because there the ECU has already corrected the mixture and the wideband reads stoich no matter how wrong the table is. The two are never mixed.
A cell needs several agreeing samples before it gets a number, and shows its count. Wild corrections are clamped and flagged.
On this ECU a percent in the full-load table isn't a percent of fuel. The table is geared down inside the injection maths, so the app converts measured error into the cell change that delivers it, using your own tune.
The simulator puts the proposed table under your fingers. Tap or drag cells, nudge them ±1% or ±5%, undo, or fill from the log. It redraws the log's AFR as if the table had carried your edits, and scores the window: samples moved, samples held by the ECU's trims, AFR before and after.
Edits cap at ±15% per flash. Bigger moves are repeated flashes with a log in between. Export sends the proposal as CSV to your tuner. The simulator never writes the bin itself.
Dashboards
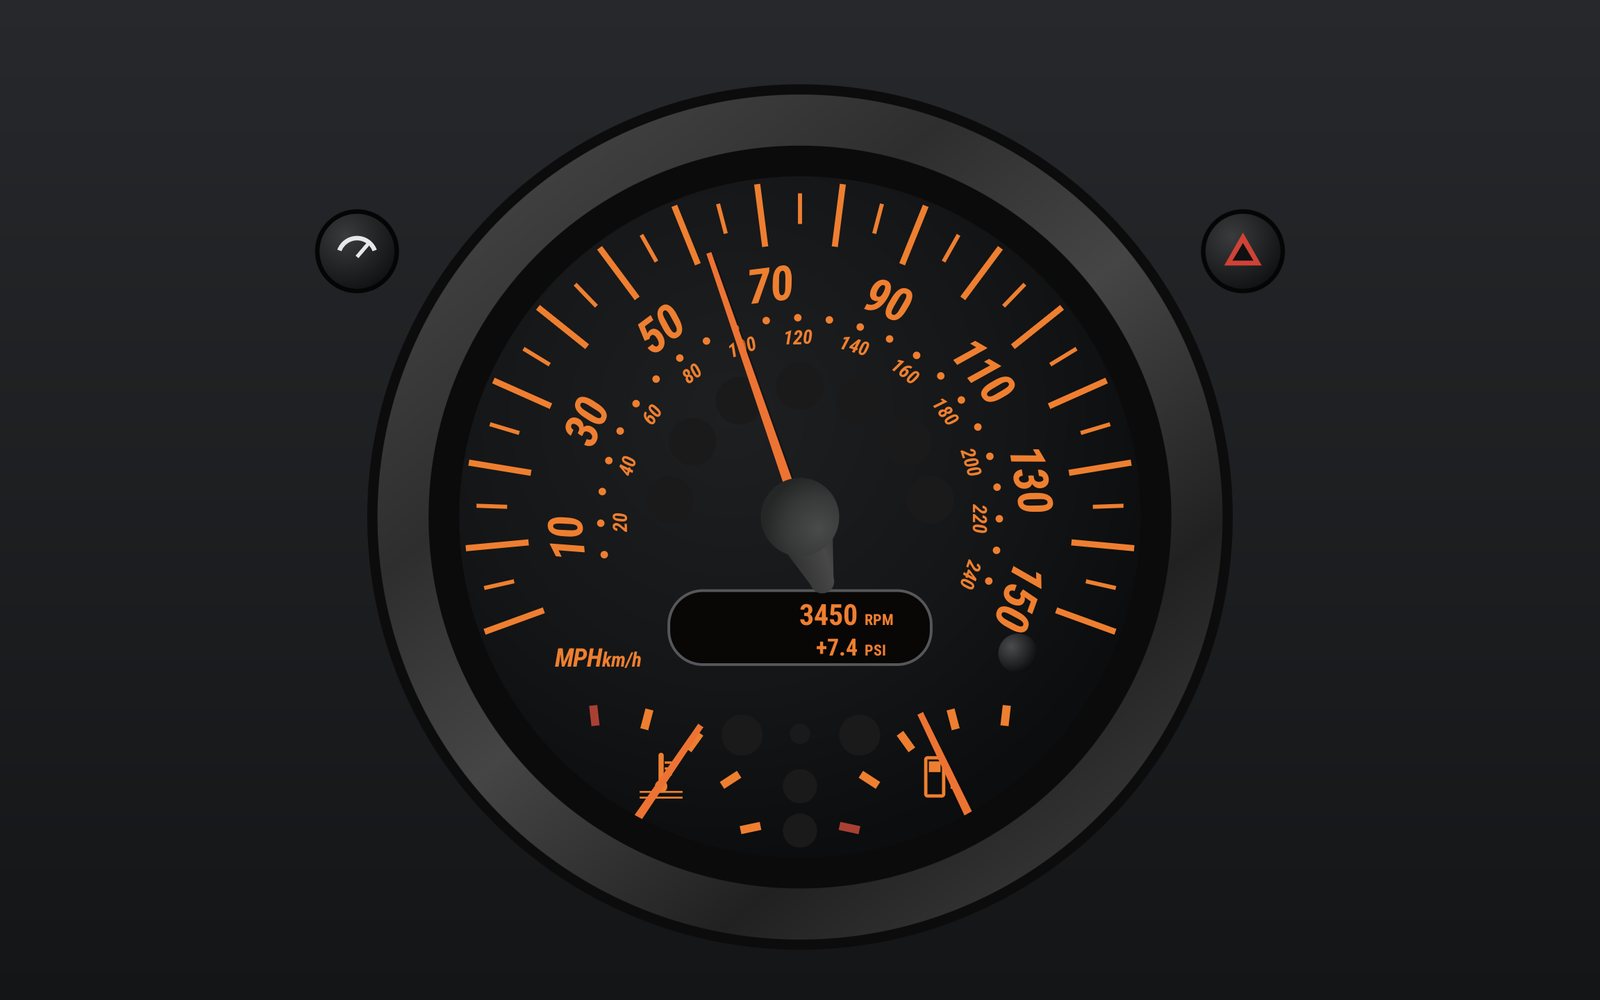
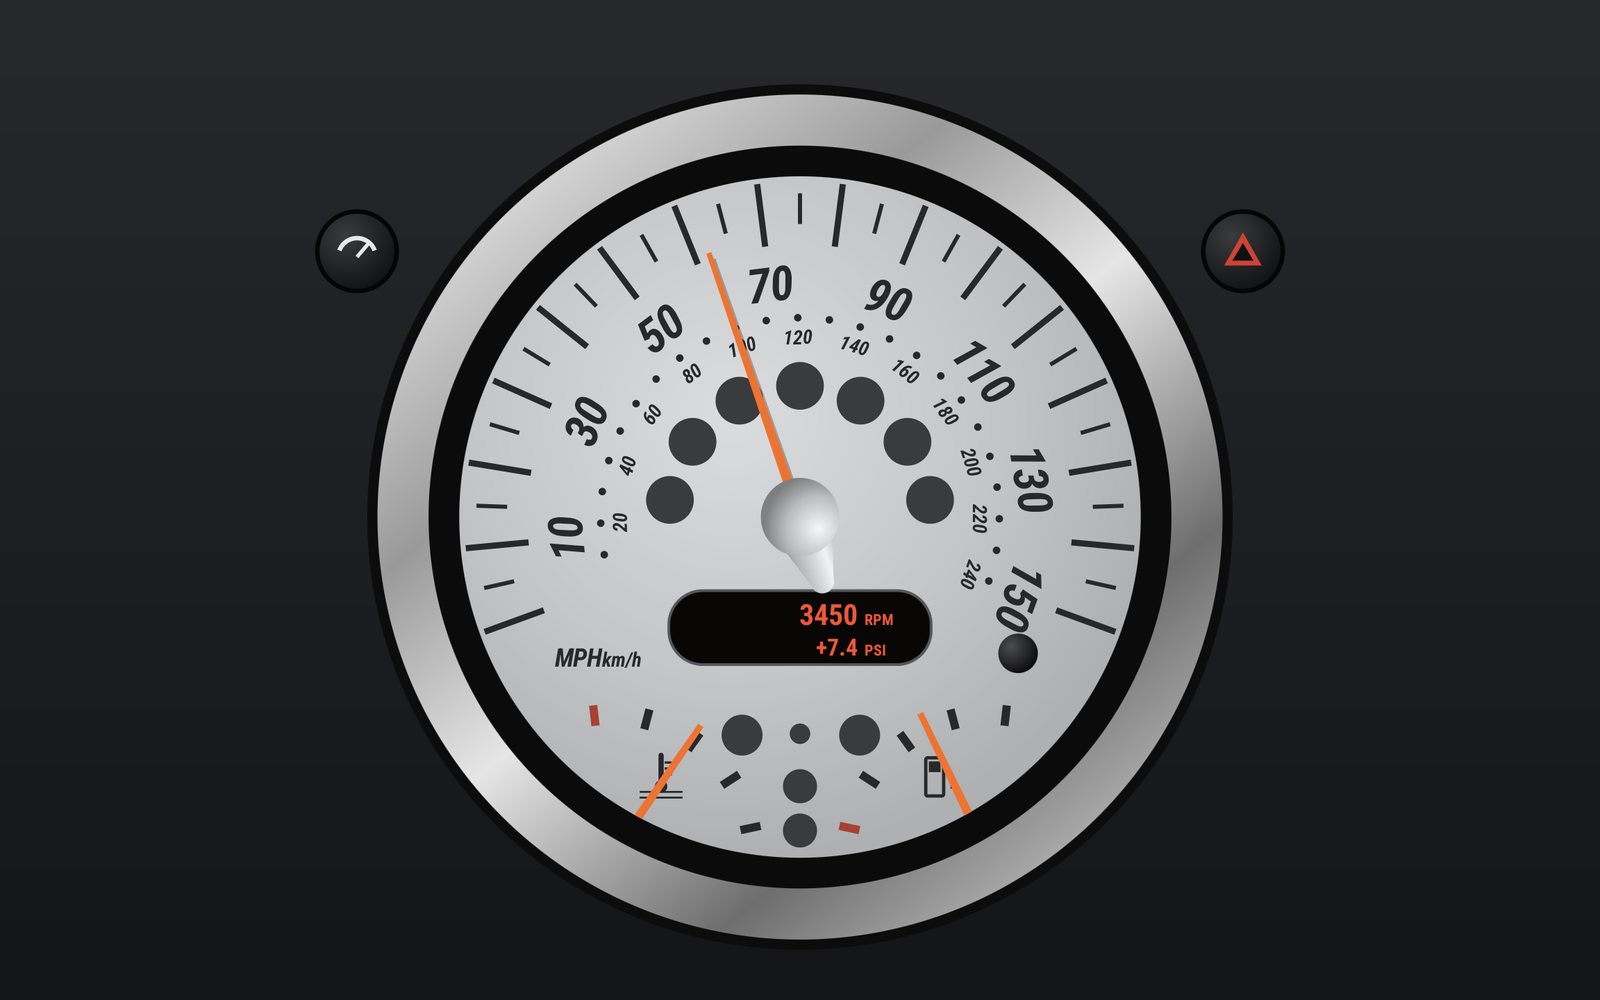
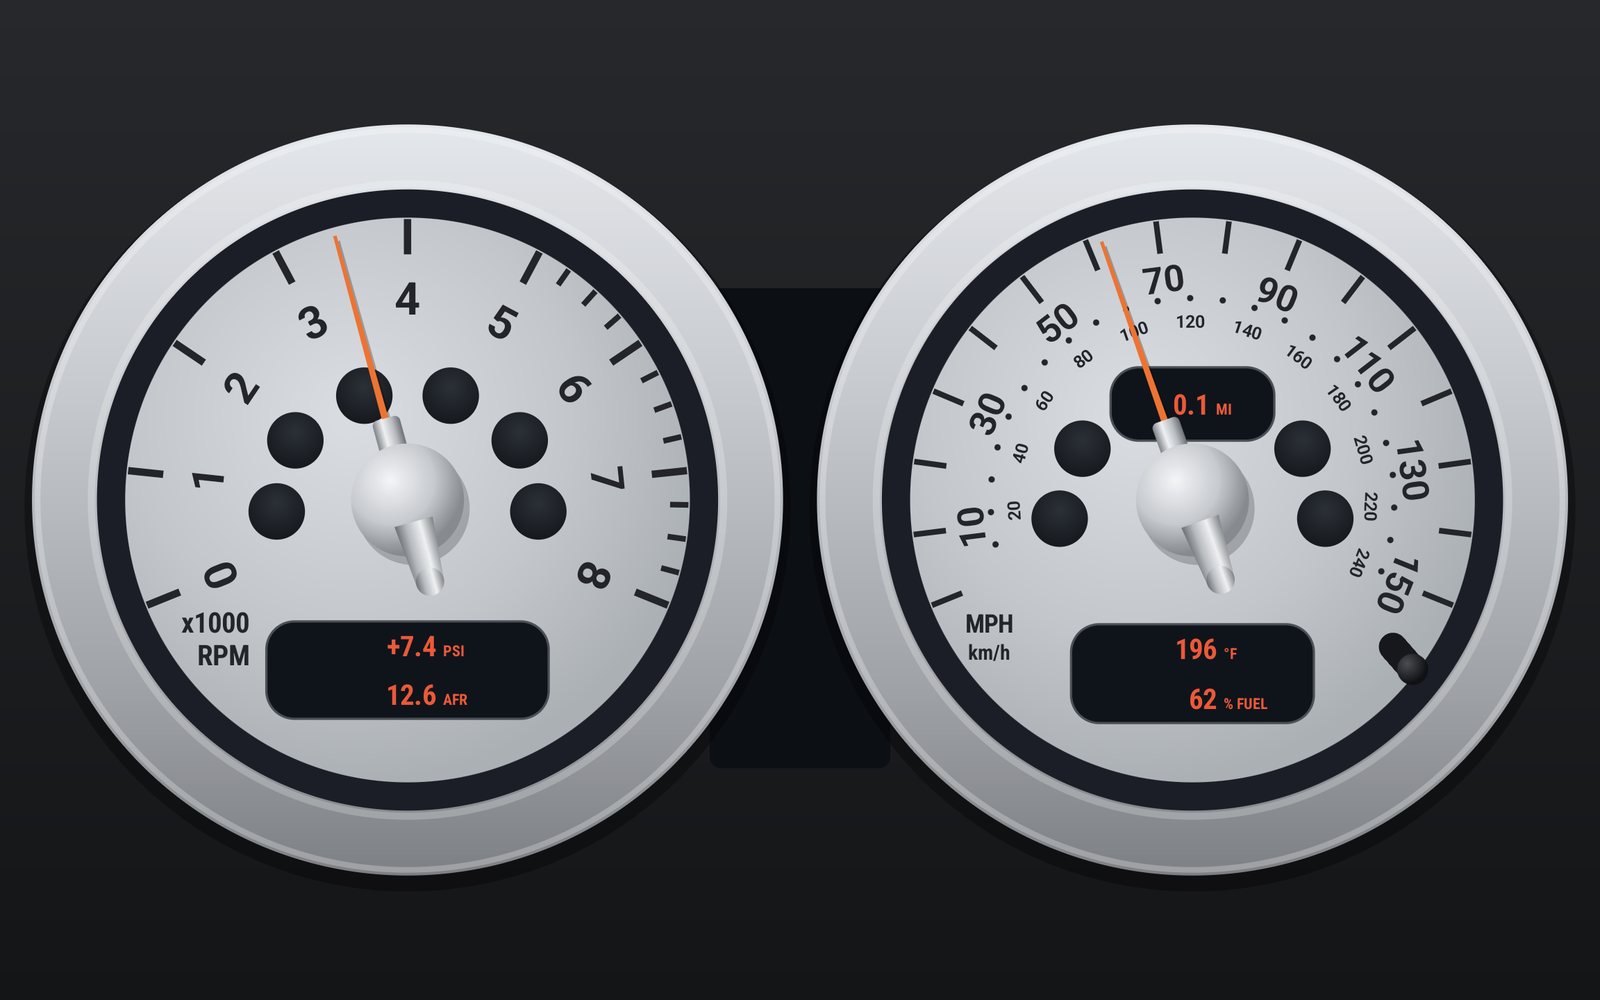
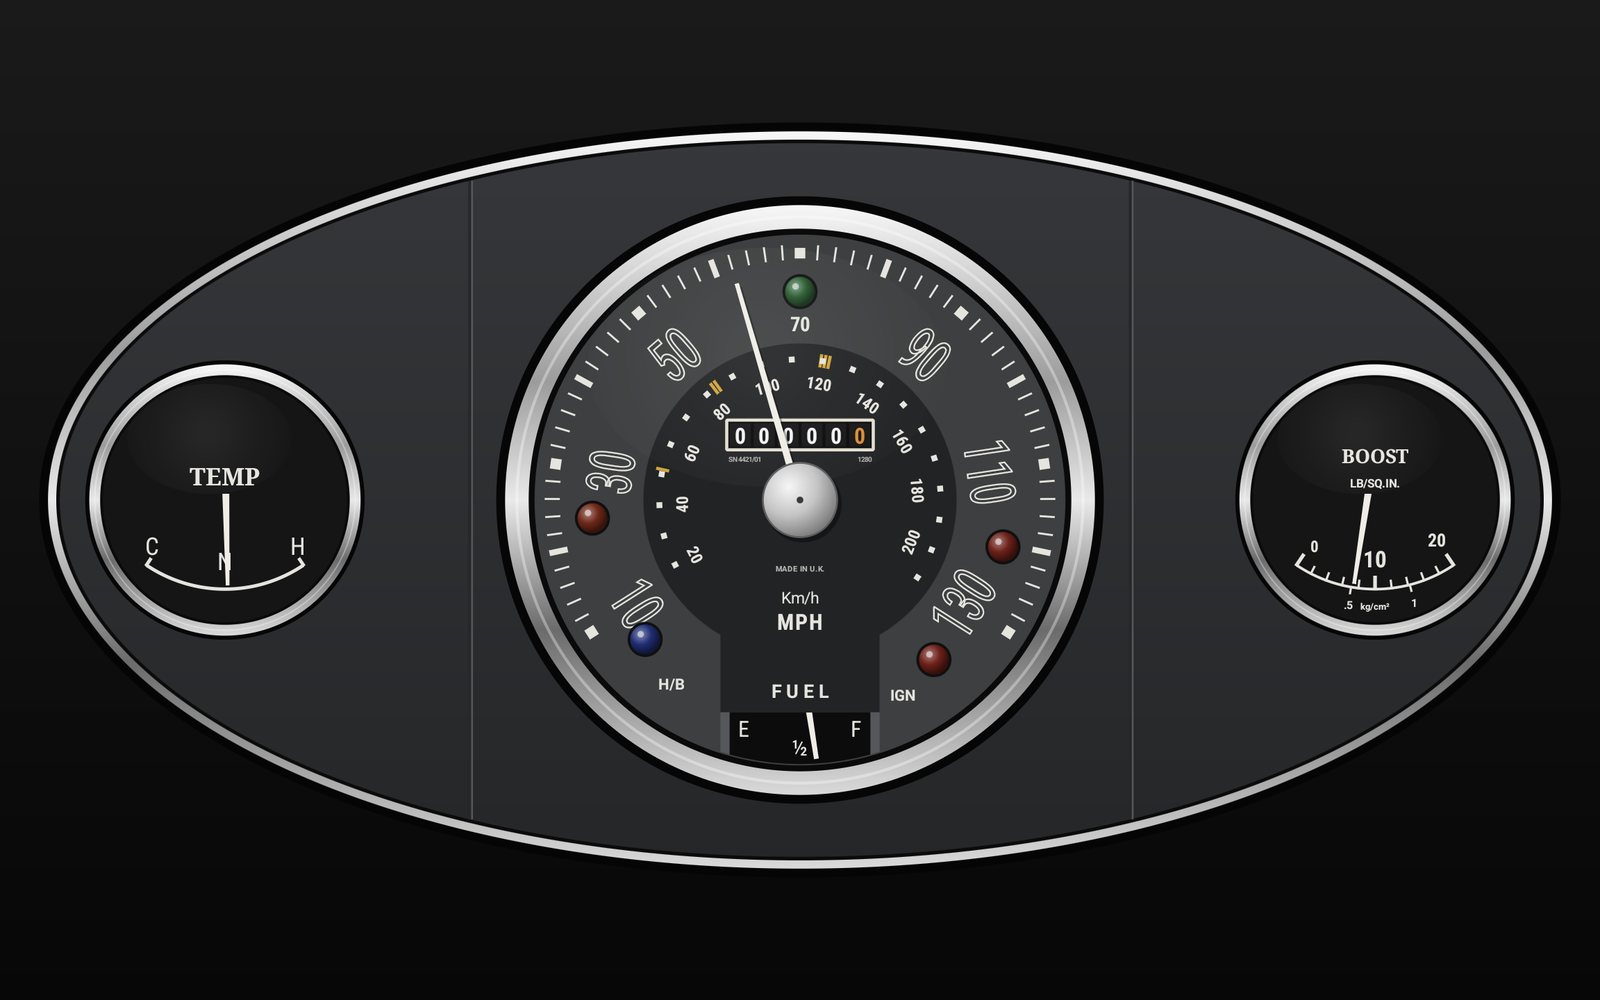
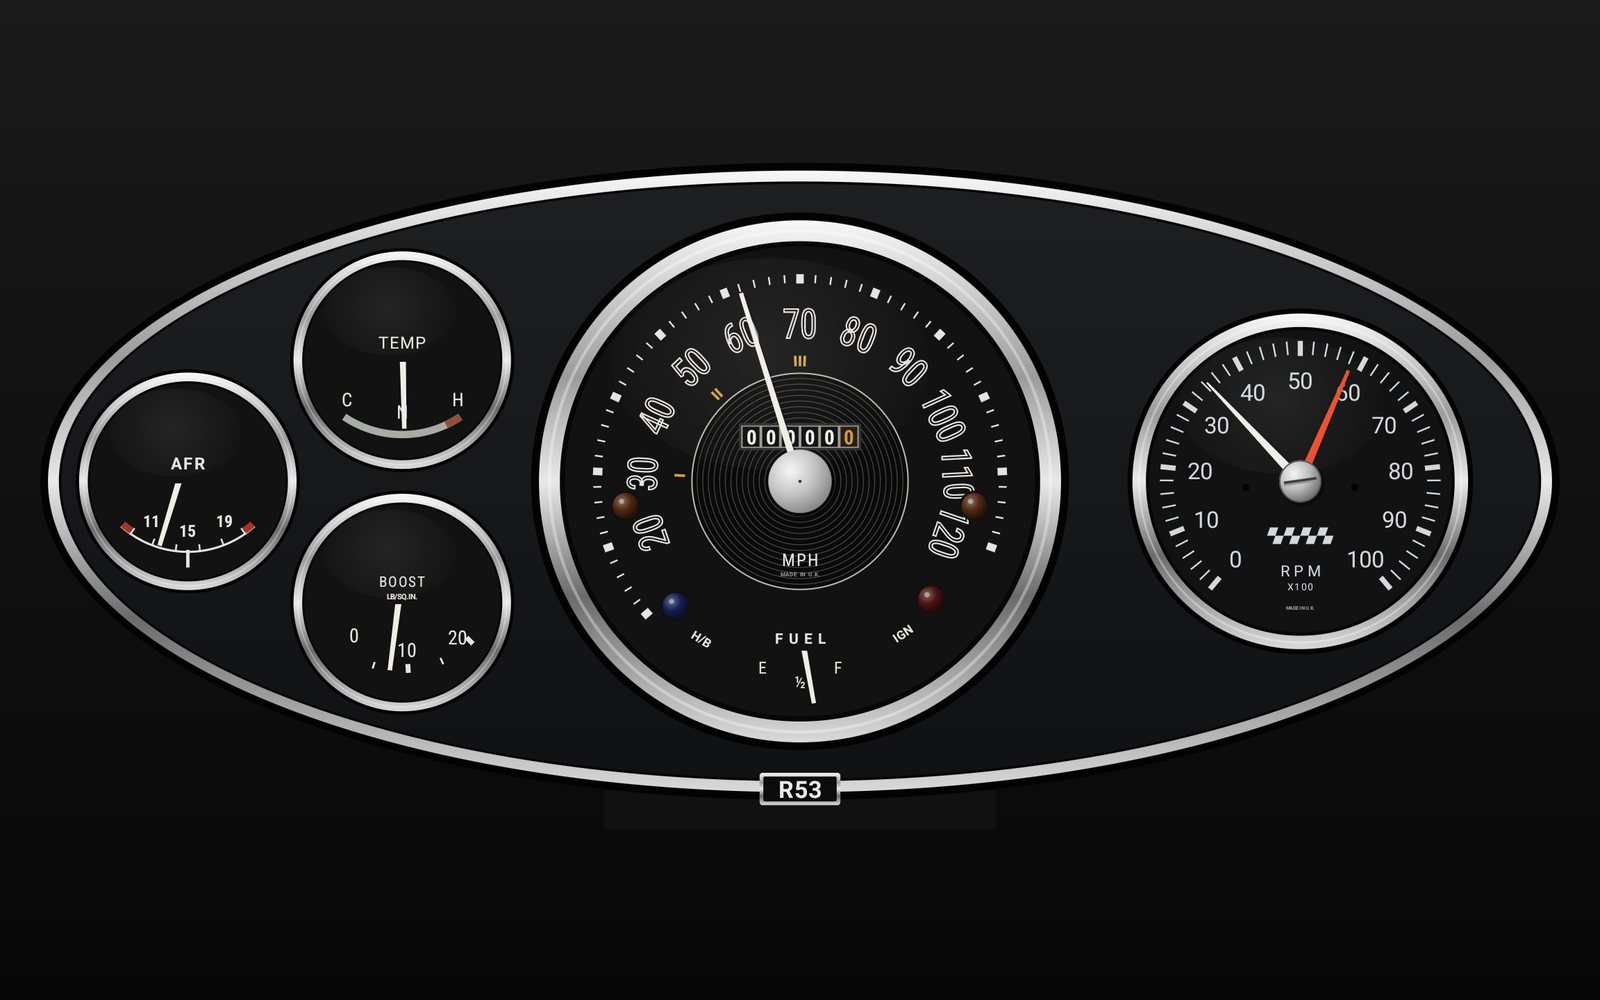
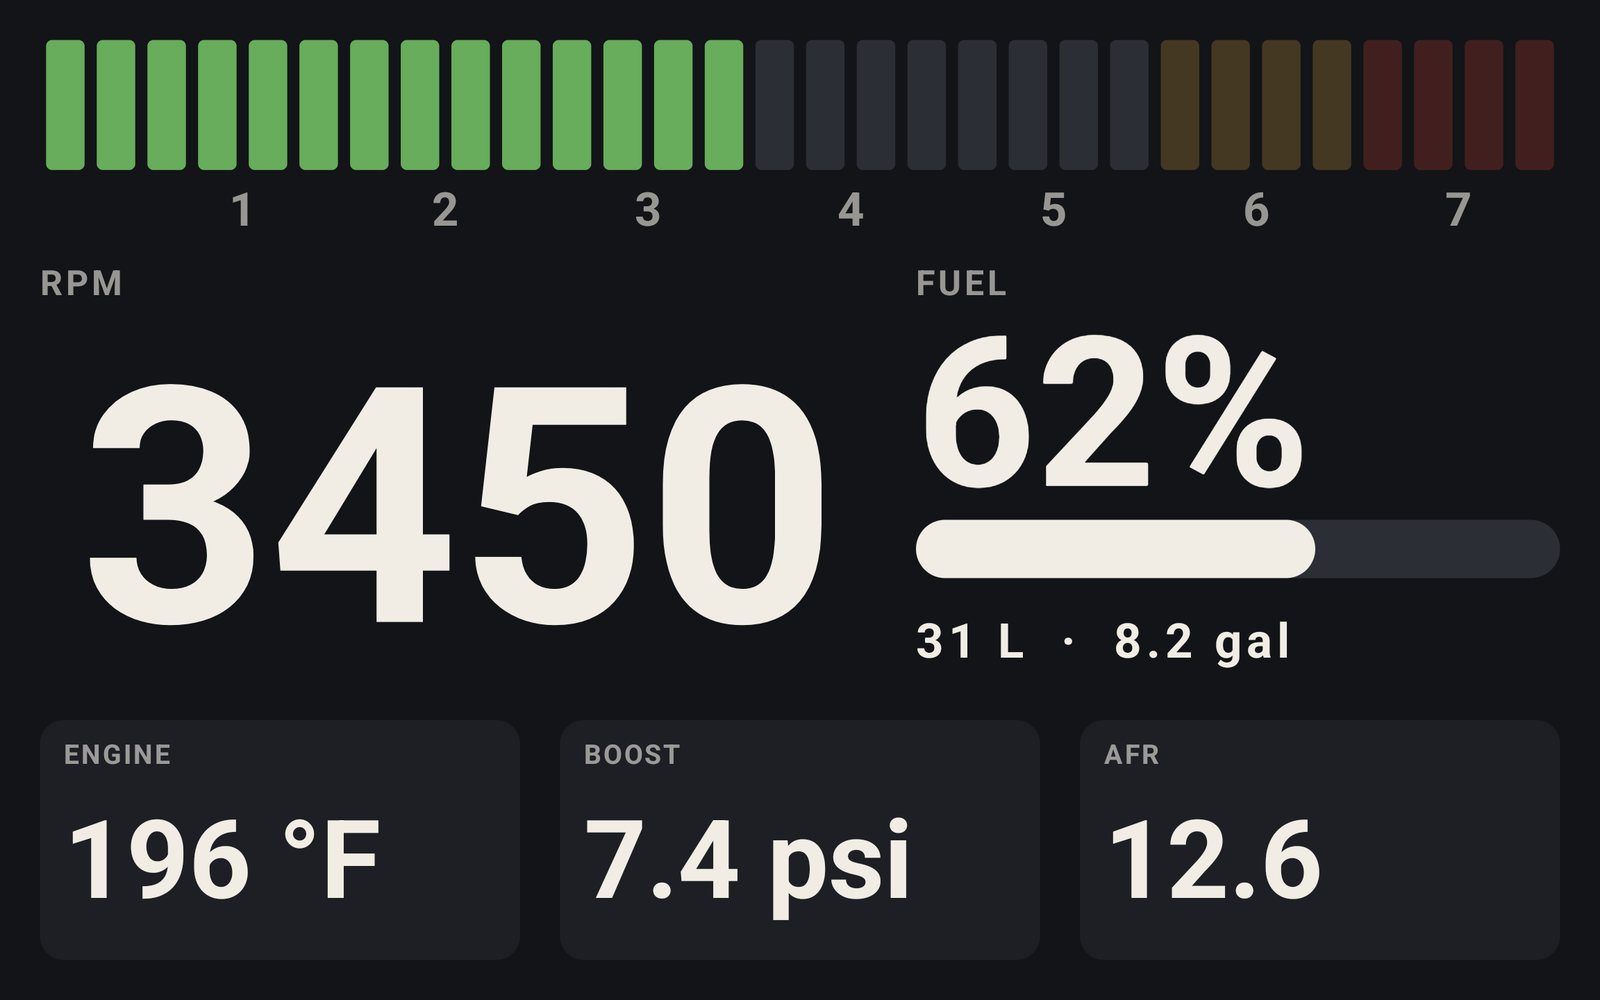
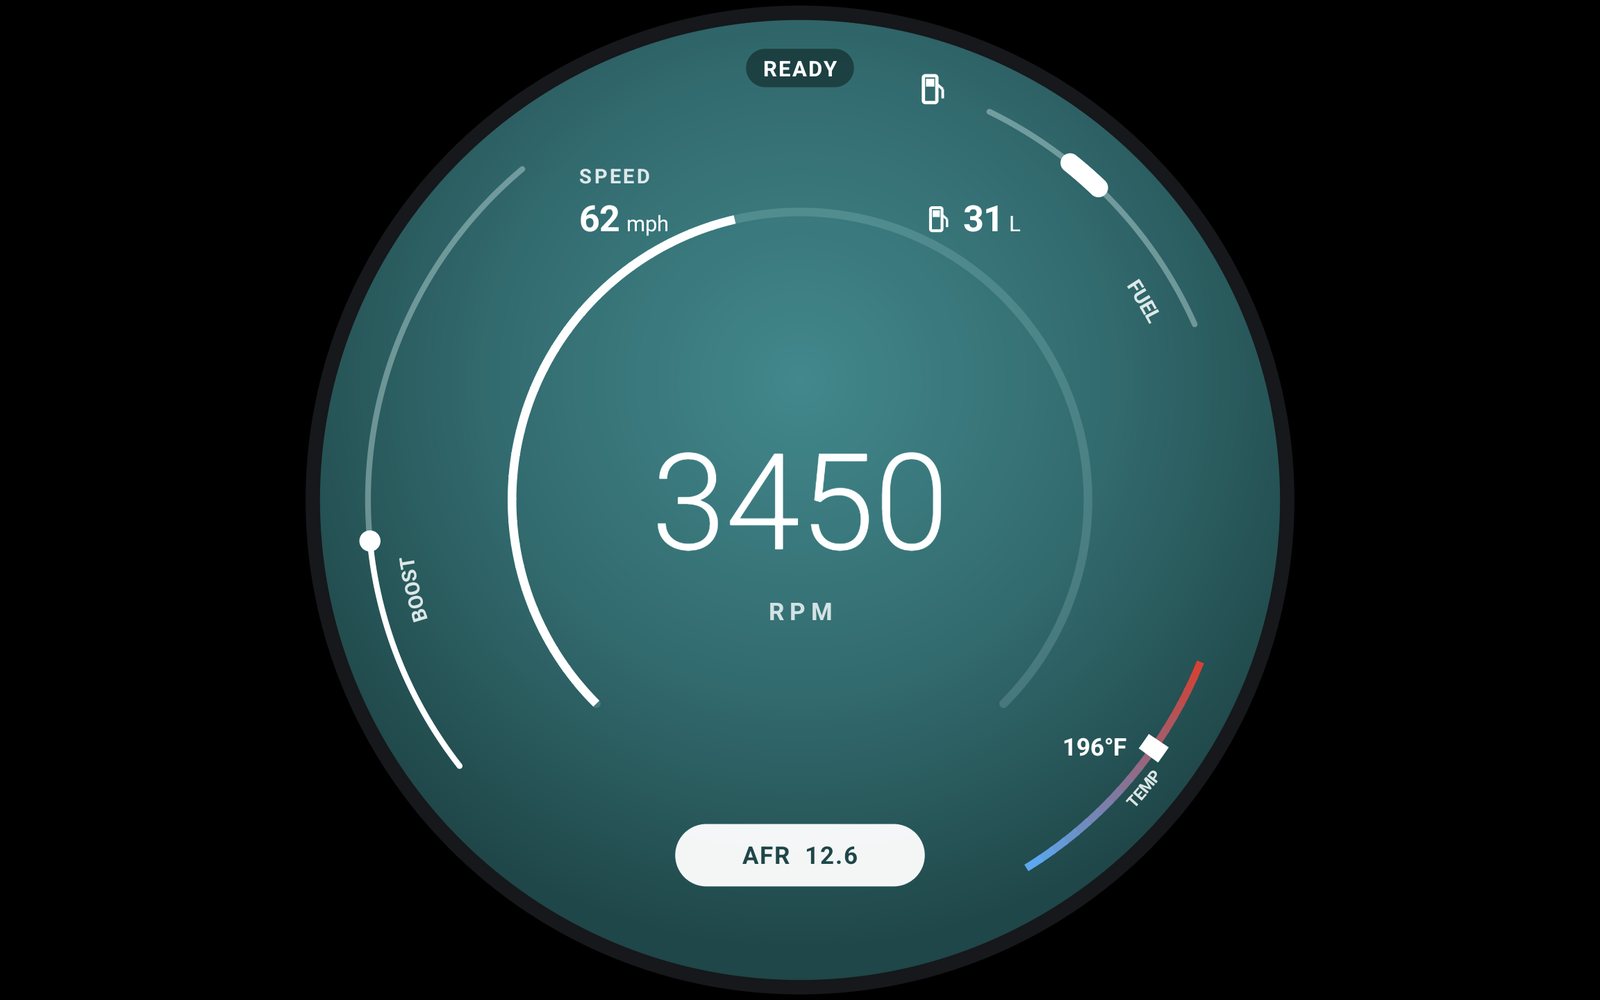
Put a tablet on the dash and the same live data drives six full-screen dashboards. Tap to change the face. Hold for the lights.
Lights
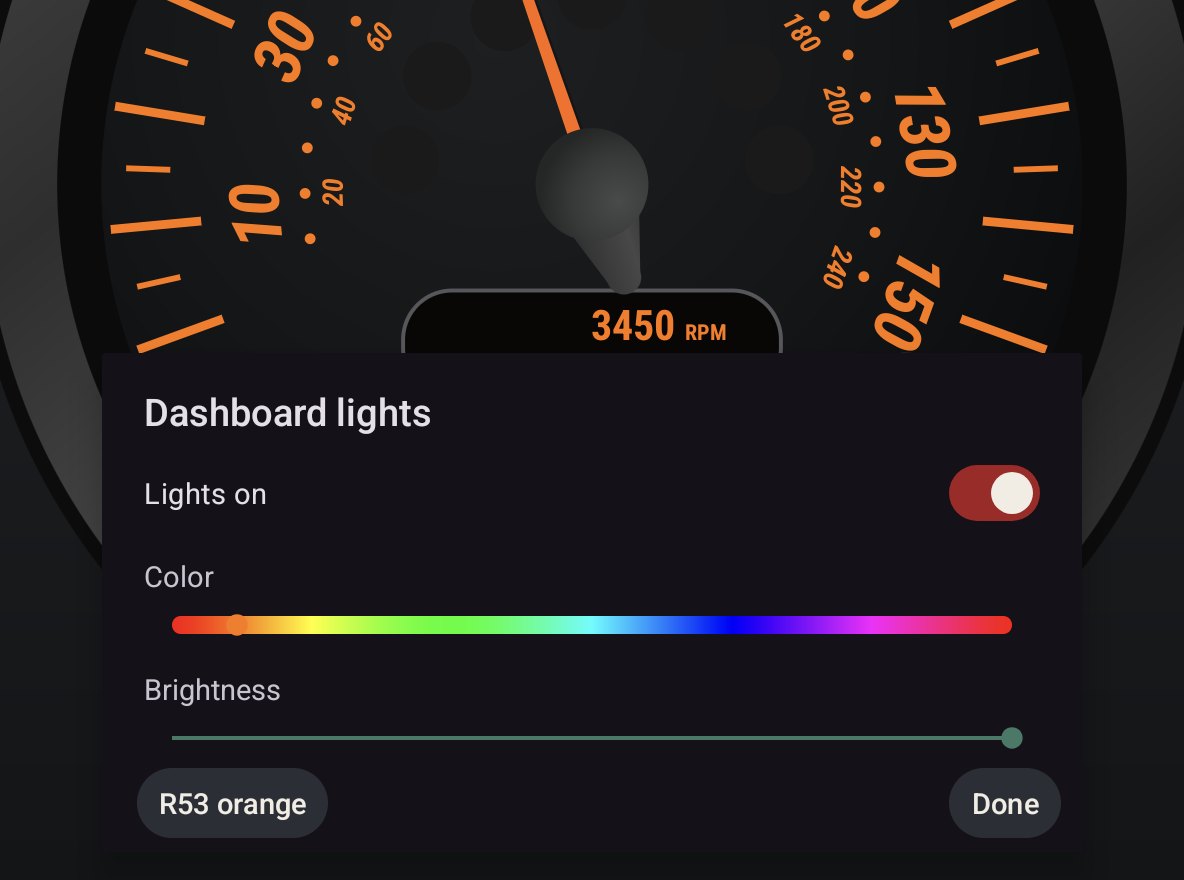
Hold the dashboard and a panel comes up over it: lights on or off, any color along the slider, and brightness down to 10%. It starts on R53 orange, and the face behind the panel changes as you drag.
R53 and Chrono are drawn as the silver day dials. With the lights on they go dark and the print glows, like the car's own at night. Chrome and silver dim, and the needles stay orange.
The other four keep their dials and take the color on their print. Brightness dims the whole face, needles and lamps included, the way the car's dimmer does.
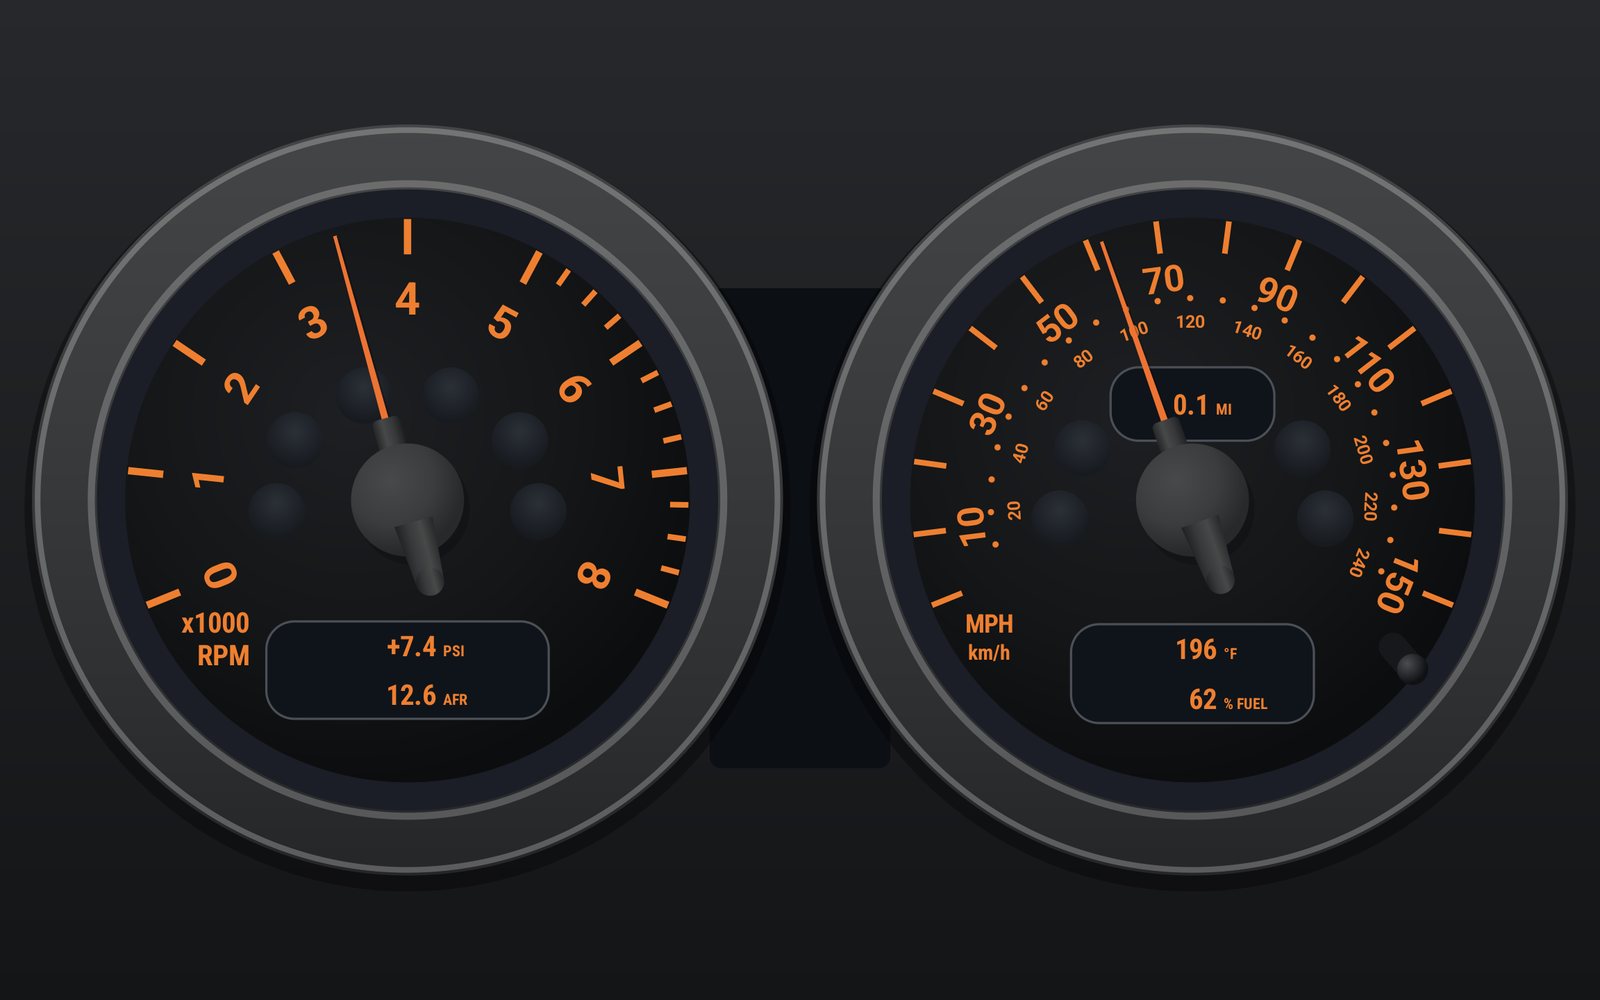
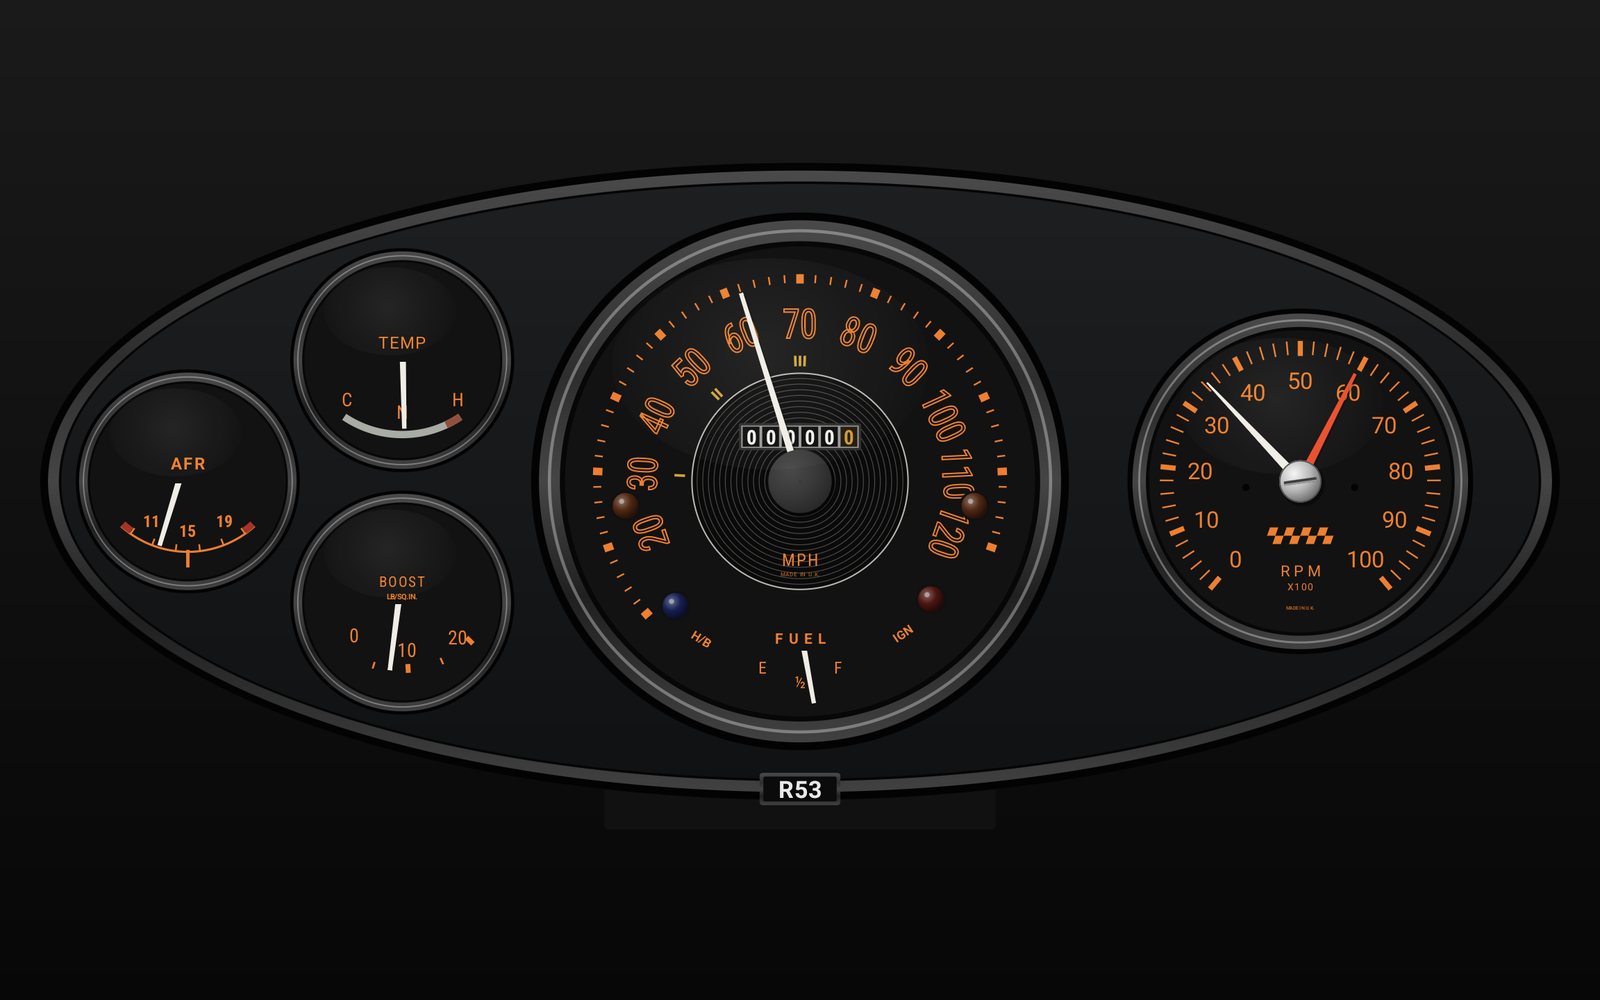
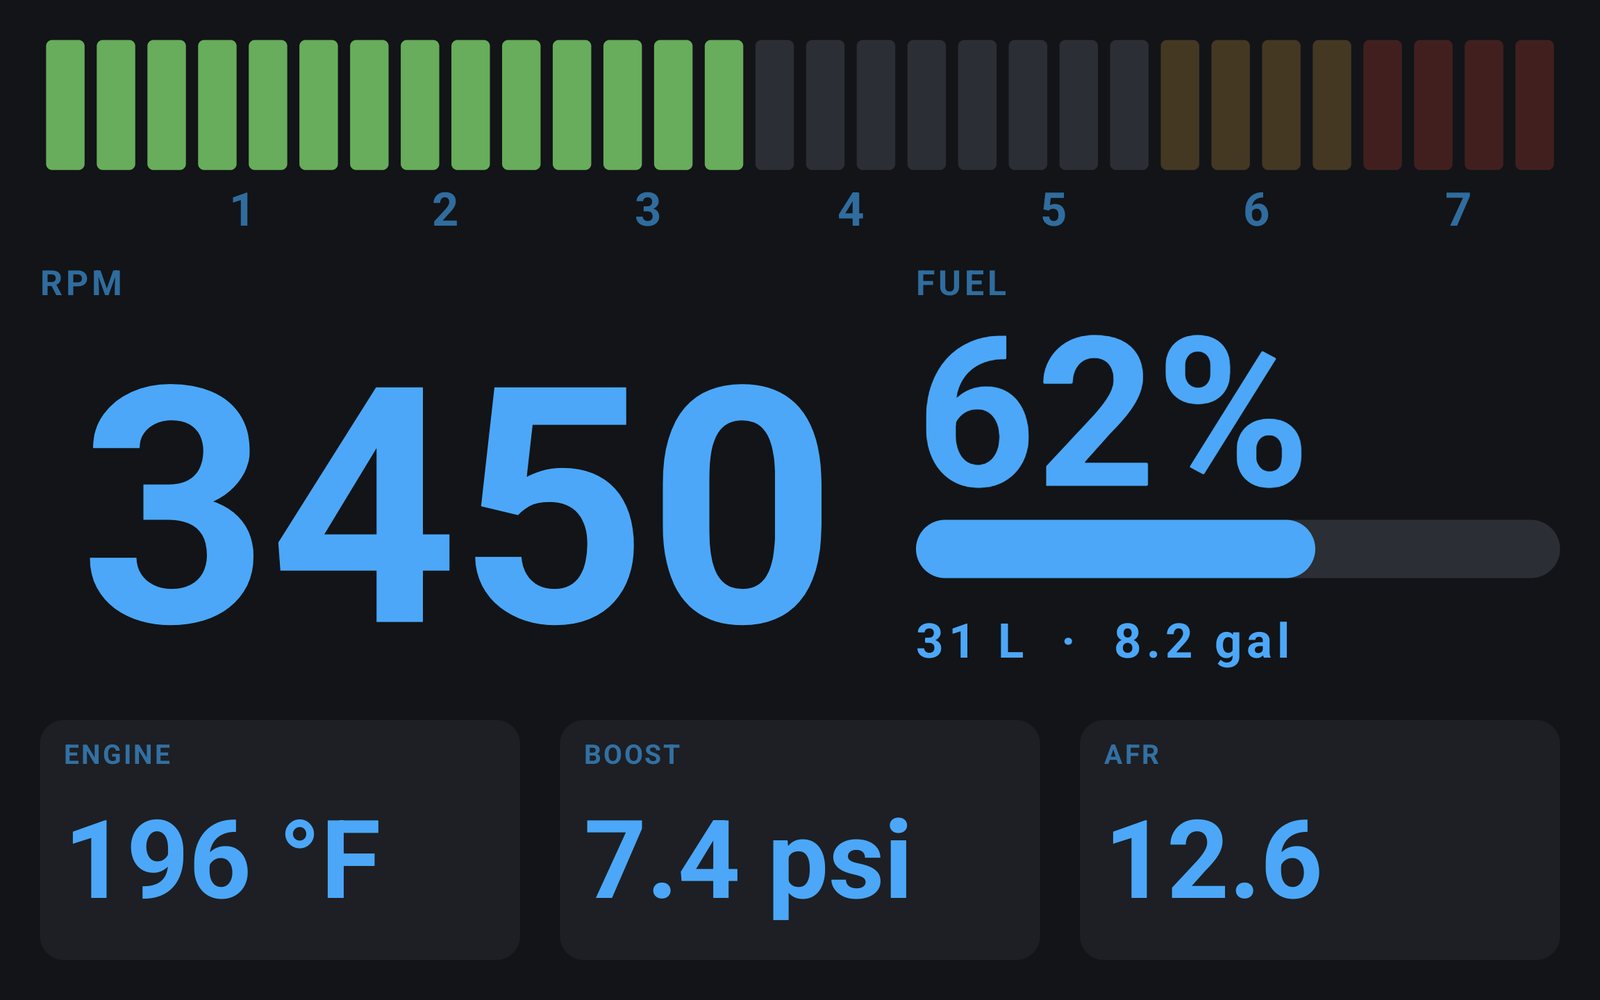
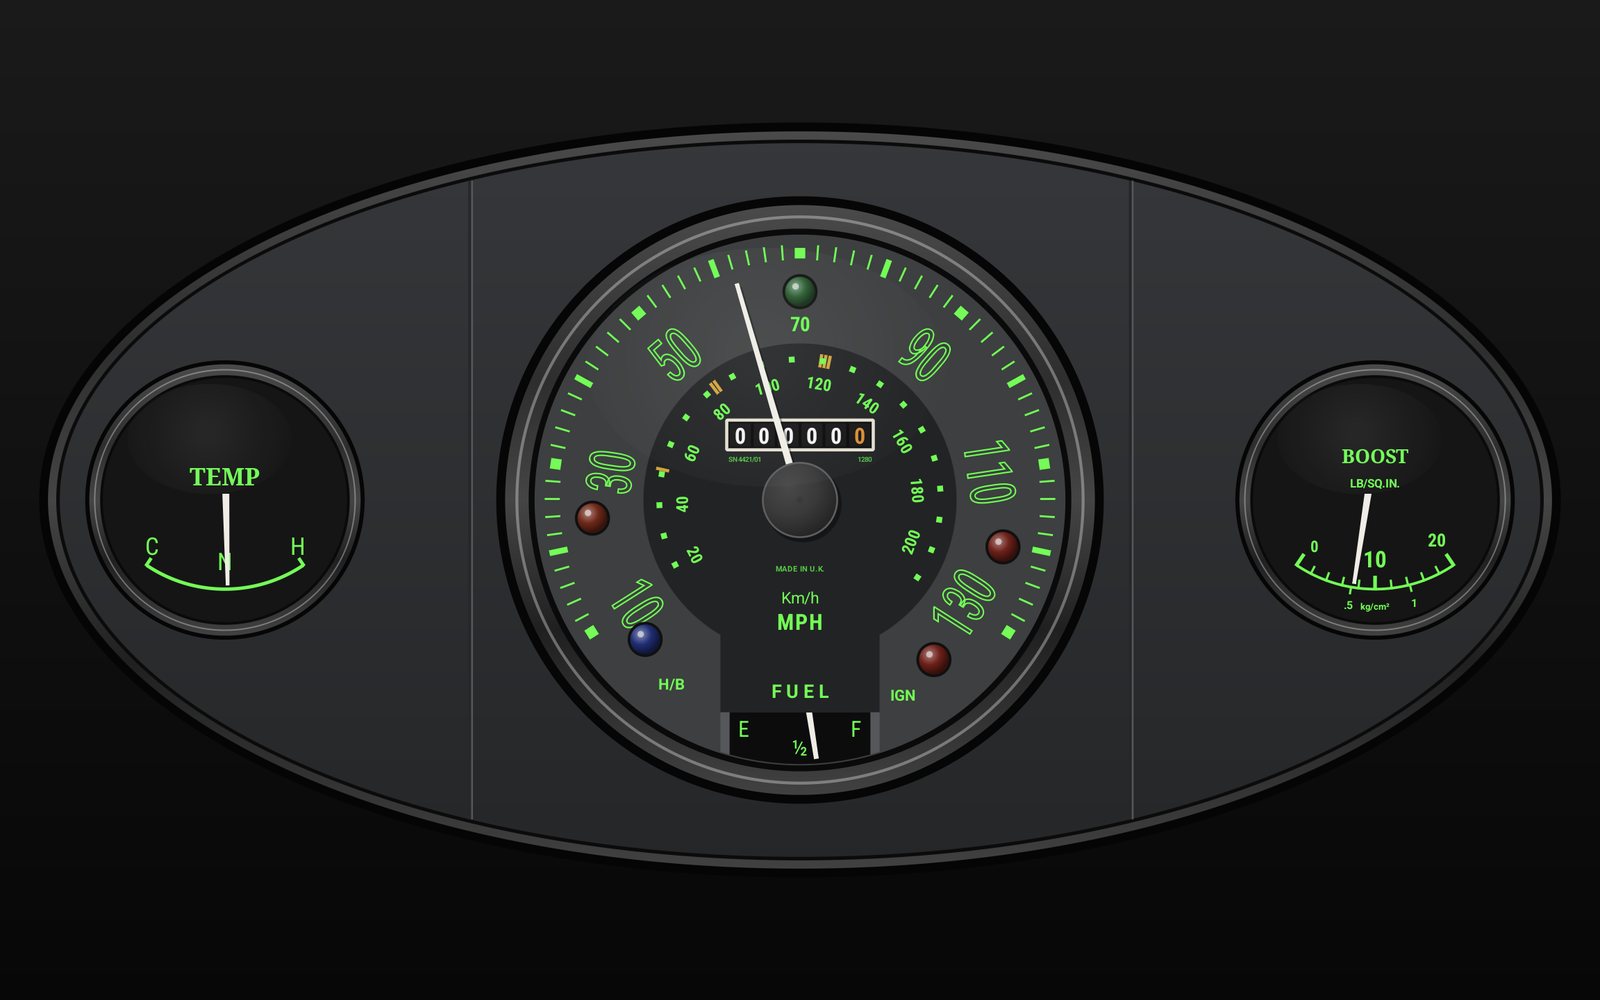
Fuel level comes off the CAN bus, so it needs the bridge. Everything else comes from the K-line or the bridge. Screenshots from a Galaxy Tab S10 FE, with demo readings.
Garage
One phone, several Minis. Every backup, flash, fault read and log files under the car it came from.
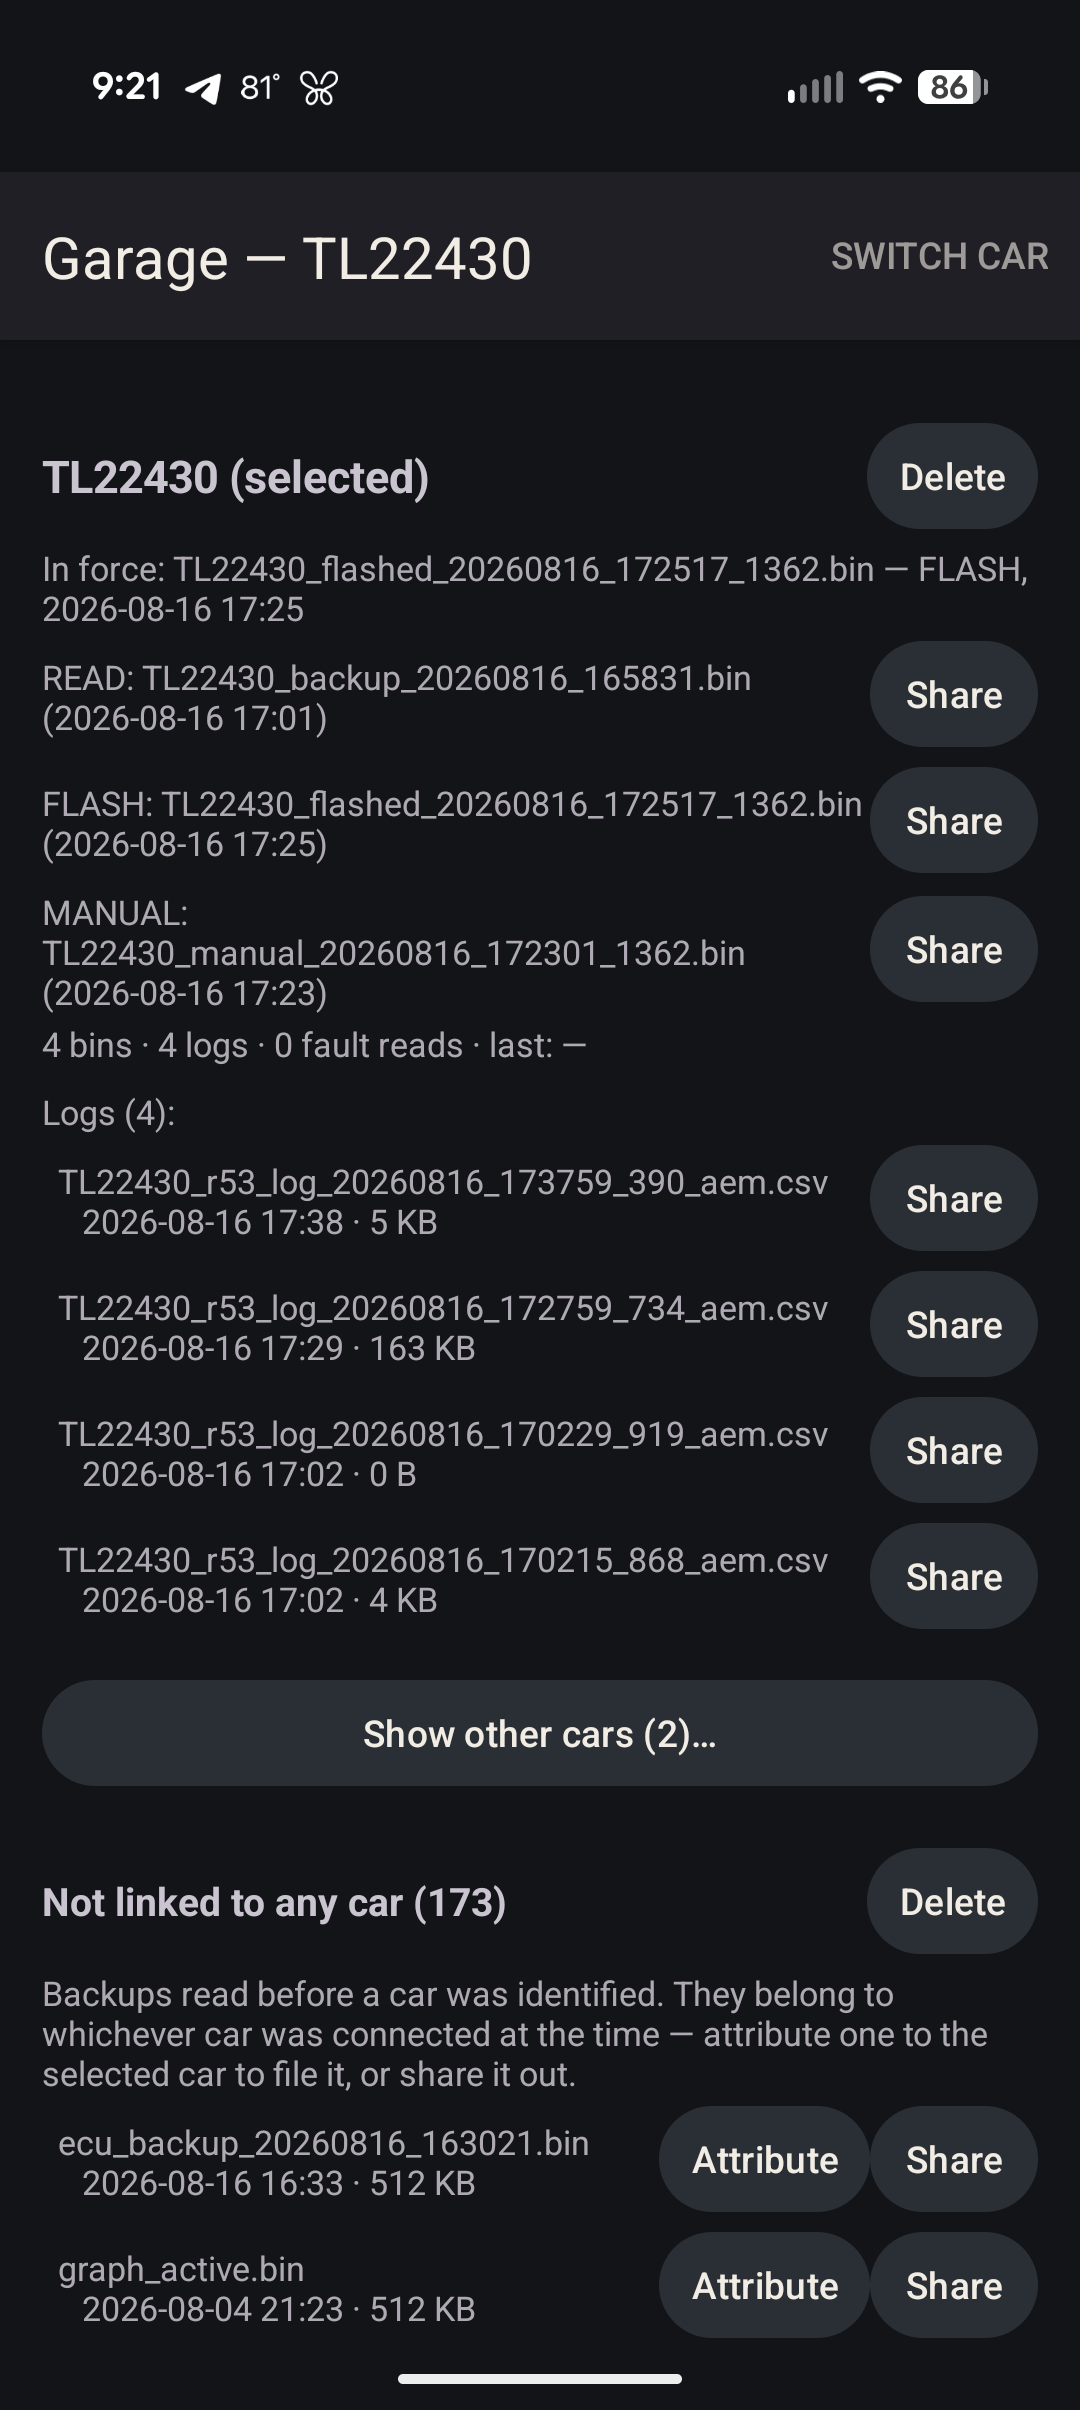
The app reads the VIN from the cluster at connect and files everything under that car. When it can't tell which car a file belongs to, it asks instead of guessing, because a flash on the wrong car writes one car's tune into another car's ECU.
Each car shows what's in force on the ECU right now. The whole Garage exports to a zip and imports on another phone without overwriting anything.
Diagnostics
Fault codes from every module in plain English, with the likely cause and the fix.
Engine, body (BC1), immobiliser (EWS), cluster, ABS/DSC and airbag codes, each translated with R53-specific notes. A lean code says check boost and vacuum leaks first, and a P0116 points at the thermostat. Codes clear where the clear command is known, reports share from the phone, and every fault read files into the car's history. Adaptation resets are there too, for after hardware changes.
Get it
It's on Google Play for any Android phone or tablet. Search for R53 Logger, or tap below on your phone.
Install from Play rather than sideloading, or purchases won't work.